
 3 months ago
20
3 months ago
20 
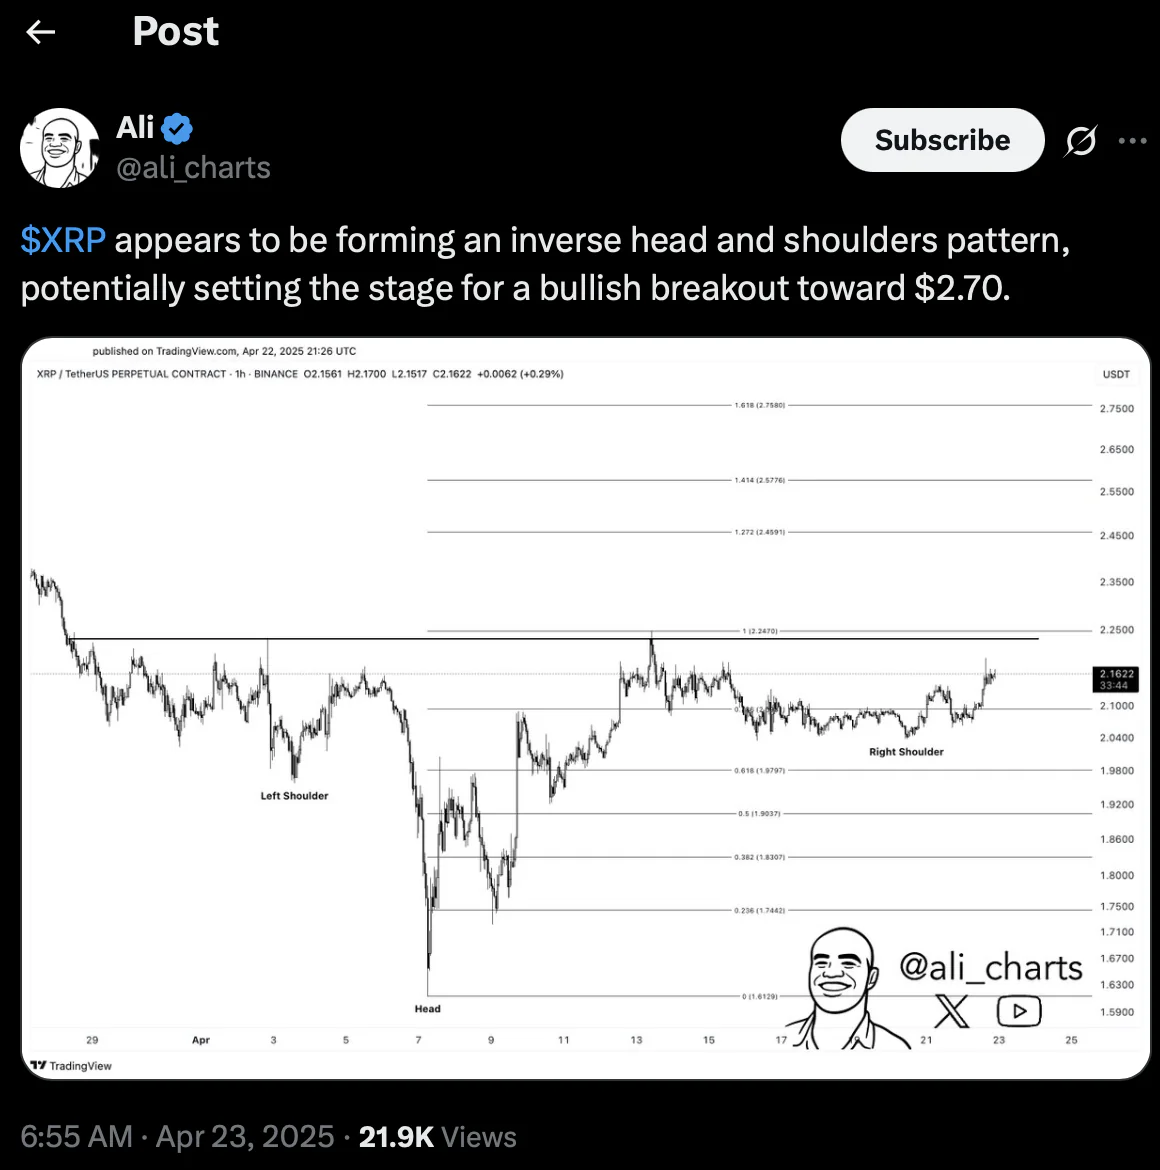
The pattern is a classic sign of a reversal trend and is often associated with a shift from a downtrend to an uptrend. This analysis, posted by trader Ali (@ali_charts) on Twitter, highlights the key price levels and expectations for XRP’s movement.
XRP’s Current Price Action
In the chart provided, we can observe XRP’s recent price action, which has followed a downtrend but is now showing signs of a potential reversal. The critical components of the pattern are as follows:
The left shoulder forms when XRP drops to around the $1.80 level. The head marks a deeper drop, reaching near $1.60. The right shoulder shows a higher low, which is already forming above the $2.00 level.This pattern is starting to take shape, with the price moving upward after forming the right shoulder. XRP is approaching key resistance levels, making the breakout all the more imminent.
Key Levels to Watch
Traders often look for confirmation of the breakout by monitoring the price’s movement above the “neckline,” a resistance line drawn across the peaks of the shoulders. For XRP, the neckline is located around $2.50, a level that, if surpassed, would signal a bullish breakout.
The chart also includes Fibonacci retracement levels, which are often used to predict potential price targets. These levels provide possible resistance and support zones, helping traders anticipate where the price might pause or reverse during its movement.
Target Price: $2.70?
Based on the analysis and the formation of the inverse head and shoulders, the potential breakout could push XRP’s price toward the $2.70 mark. This would represent a significant upward move from its current price of around $2.16. A bullish breakout above the $2.50 resistance level could open the door for XRP to reach this price target, as it builds momentum from the newly established pattern.
Conclusion
The inverse head and shoulders pattern on the XRP chart presents an exciting potential for a bullish move. If XRP manages to break above the key resistance at $2.50, we could see a surge toward the $2.70 level. However, as with any technical pattern, it is crucial for traders to stay vigilant and watch for confirmation of the breakout. With the overall market sentiment and technical indicators aligning, the next few days could prove critical for XRP’s price action.
The post XRP: Here is Why The Price Could Reach $2.7 Soon appeared first on Coindoo.


.jpg.webp?itok=1zl_MpKg)


 Bengali (Bangladesh) ·
  English (United States) ·