
 3 months ago
16
3 months ago
16 
The analysis, based on a 4-day XRP chart, explores both a bullish continuation and a potential long-term correction.
Primary Yellow Scenario: One More High Before a Larger Correction for XRP
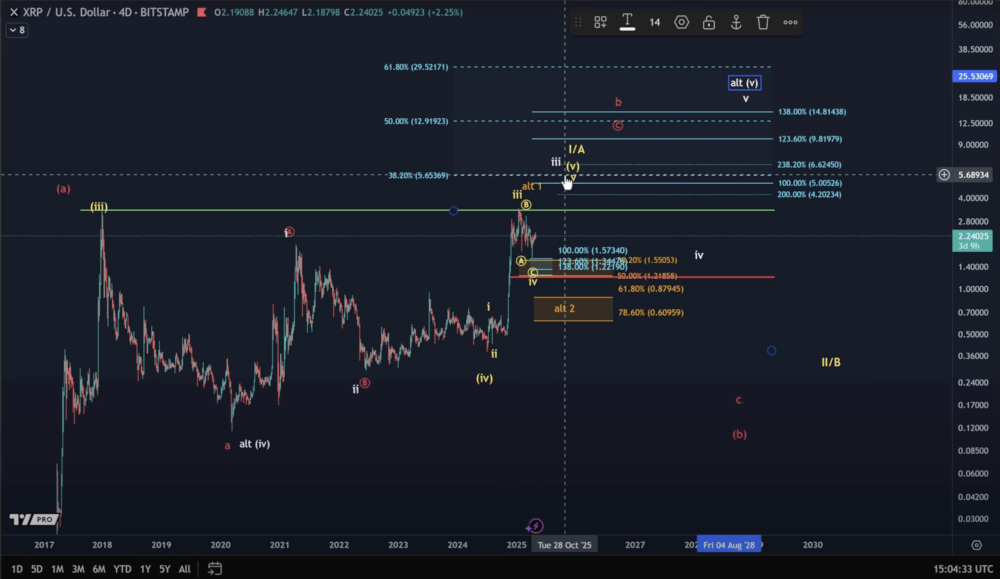
The main structure tracked by MCO, referred to as the “yellow scenario,” suggests that XRP is completing a five-wave Elliott Wave cycle that began at the 2013 low. In this scenario:
Waves 1 through 3 have already completed Wave 4 is forming a triangle Wave 5 is expected to push XRP to a new all-time high (ATH)According to Elliott Wave principles, the completion of a five-wave pattern from a macro low usually signals the start of a substantial correction. In this case, MCO suggests a potential retracement back to the $0.40–$0.50 region—roughly where the prior Wave 4 formed. While some may doubt the plausibility of such a drop, history offers precedent. After peaking near $3.40 in 2017, XRP collapsed to $0.11, underscoring that sharp corrections are part of crypto market cycles.
Despite recent downside movement, MCO maintains that the current pullback lacks the strength and structure to confirm a macro top. Therefore, the analyst continues to favor the idea of one final upward push.
Alternate White Scenario: Bull Market Began in 2020
The alternative “white scenario” interprets XRP’s current structure differently. Rather than concluding a macro bull cycle, this model assumes that the bull market only began in 2020. The implications are:
The current move is part of a larger third wave
Two more waves (4 and 5) are still expected to complete the cycle A correction will still follow, but it may be less severe than in the yellow scenarioThe correction, when it arrives, would likely match the time and scale of previous wave two corrections, possibly taking up to a year to unfold. MCO classifies this scenario as less likely but still within the realm of possibility.
Short-Term Structure and Key Levels for XRP
Zooming into shorter timeframes, MCO observes a developing five-wave structure from the April lows. However, the pattern is not clearly defined, and upside momentum appears limited. While XRP continues to print higher highs and higher lows, the market remains in a somewhat fragile state.
Key price levels to monitor include:
$2.12 (Wednesday’s low) – Holding above this level keeps the bullish outlook intact, with potential targets in the $5.00–$6.60 range. A drop below $2.12 could trigger a broader B-wave correction, targeting the $1.84–$2.01 support zone.Conclusion
The outlook for XRP remains constructive in both scenarios, with an additional rally expected before a larger correction. Whether XRP completes a full macro five-wave structure or continues a more recent bullish cycle, the asset appears poised for upward movement in the near term.
However, investors should be prepared for eventual volatility and potential retracement. As always, staying aware of key support levels and wave developments is crucial in managing risk and identifying trading opportunities.
For more detailed insights, viewers can follow More Crypto Online on YouTube, where regular technical updates and wave counts are shared.
The post XRP Forecast: Two Competing Wave Scenarios Could Define Next Major Move appeared first on Coindoo.


.jpg.webp?itok=1zl_MpKg)


 Bengali (Bangladesh) ·
  English (United States) ·