
 1 day ago
4
1 day ago
4 

Analysts point to weakening structure, low volume, and persistent selling activity that could determine whether the asset stabilizes or slides into deeper lows.
Analyst Flags Critical “Dead Zone” for WLD
In a recent X post, analyst Lamatrade described the current $0.80–$0.85 range as a “dead zone” for Worldcoin, reflecting limited buying interest and diminishing recovery strength. The weekly chart shows that after the token’s strong 2024 rally, momentum has faded sharply, with sellers maintaining control below the $1.30–$1.40 resistance region. This range has consistently acted as a ceiling for any bullish attempts, while each rebound has been met with swift rejection.
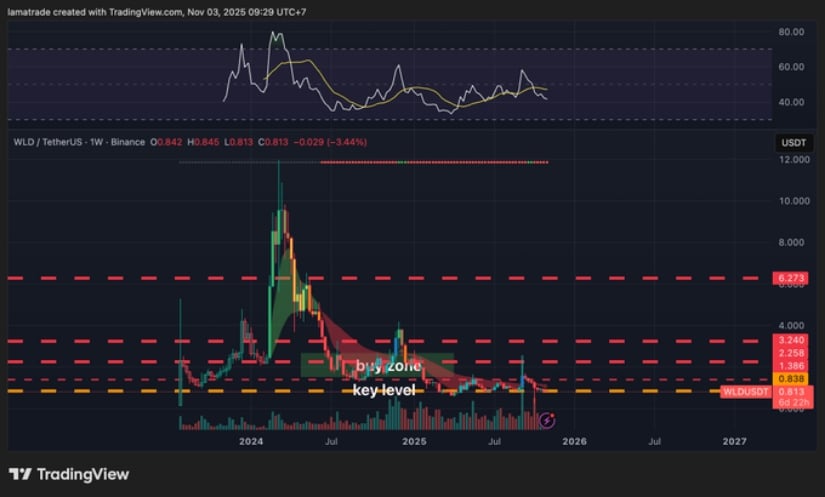
Source: X
Lamatrade notes that despite the token appearing undervalued, the broader structure remains bearish. The RSI continues to trend below 50, signaling weak buyer engagement, while volume levels have tapered off significantly, an indication of fading participation and market fatigue. Losing the $1.00 psychological mark could open the door to deeper declines toward the $0.60–$0.70 area, which previously served as a structural pivot in early 2024.
Market Metrics Show Sharp 24H Decline
According to BraveNewCoin data, Worldcoin is currently priced at $0.79, marking a 7.82% decline over the past 24 hours. The token’s market capitalization stands at $1.77 billion, with a 24-hour trading volume of $133.9 million and a circulating supply of 2.27 billion tokens. This places the coin at rank 70 among global cryptocurrencies by market cap.
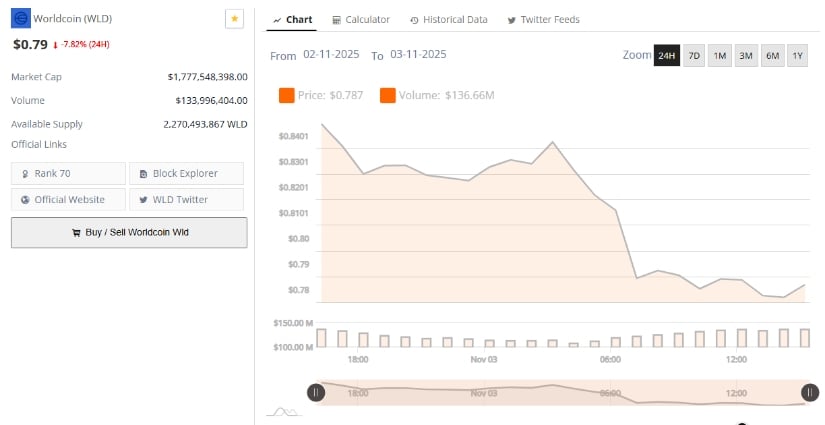
Source: BraveNewCoin
The 24-hour chart shows consistent downward pressure, with price oscillating between $0.76 and $0.81. Trading volume has fluctuated below the $150 million threshold, highlighting limited volatility despite the price drawdown. Analysts interpret this as a sign of controlled selling rather than panic dumping—a pattern typical during prolonged consolidation phases.
Analysis Confirms Weak Technical Outlook
As of the latest session, Worldcoin trades at $0.78, extending losses by over 6% on the day. On TradingView, the daily candles remain pressed near the lower Bollinger Band ($0.78), suggesting that downside momentum remains intact. The baseline at $0.87 now acts as dynamic resistance, with repeated rejections confirming that short-term sentiment remains heavily tilted toward the bears.
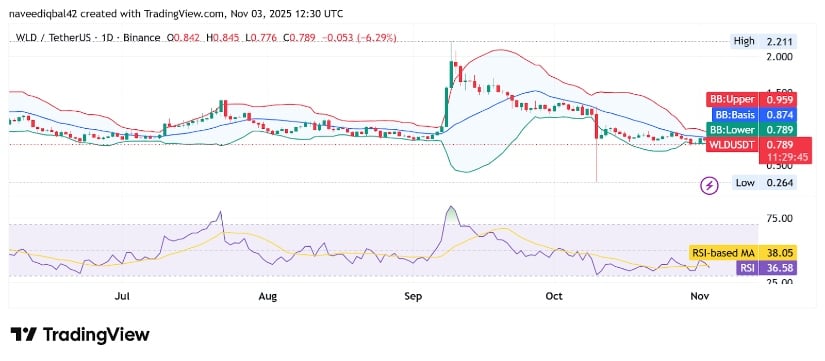
Source: TradingView
The Relative Strength Index (RSI) currently reads 36.5, with its signal line at 38, indicating conditions hovering just above the oversold zone. This reflects weak buying momentum and no confirmed bullish divergence. Historically, this RSI level has preceded minor relief rallies; however, without a supporting rise in volume, any rebound may remain short-lived.
Immediate resistance lies at $0.87, followed by $0.95, while key support levels are seen at $0.70 and $0.60. If the token fails to reclaim the Bollinger basis with convincing volume, analysts warn of a potential retest of the lower psychological zones before any structural recovery takes hold. For now, the technical setup confirms that the asset remains under pressure, awaiting a catalyst to reawaken bullish participation.


 Bengali (Bangladesh) ·
  English (United States) ·