 2 hours ago
7
2 hours ago
7 
Key Takeaways
Smart Contract Platforms and Layer-1 networks each hold near $1.8 trillion in market cap. Capital is concentrating in infrastructure sectors over speculative tokens. Proof-of-Stake led the top sectors, up roughly 2.1% on the week. The trend tracks Wall Street’s push into tokenization and staking products.The latest category rankings show investors favoring blockchain infrastructure over speculative themes, a quiet but telling shift in where the market thinks the next decade of value sits.
What the Rankings Actually Show
At the top of the CoinGecko’s category, Smart Contract Platforms and Layer-1 networks each command around $1.8 trillion in market capitalization, dwarfing every other sector. The weekly price moves are modest, fractions of a percent, but that is part of the story rather than a contradiction of it. These categories are absorbing the largest share of market value and trading activity, with tens of billions in daily volume, without needing dramatic price action to do it. Money is parking here, not chasing here.
That distinction matters. A sector that climbs 40% in a week is attracting speculation. A sector that holds the most capital while barely moving is attracting conviction. The rankings describe the second kind of behavior, the financial equivalent of capital settling into bedrock rather than darting between trades.
| Smart Contract Platforms | ~$1.82 trillion | +0.1% to +0.2% |
| Layer-1 Networks | ~$1.81 trillion | +0.1% to +0.2% |
| Proof-of-Stake | Top-five sector | +2.1% |
The roughly $1.8 trillion in each category is not two separate pools adding to $3.6 trillion; it is largely the same core group of infrastructure tokens viewed through two overlapping lenses. That overlap is itself the point: the market’s largest networks are simultaneously its base layers and its application platforms, which is exactly why capital concentrates there.
Why Infrastructure Became the Trade
The clearest way to understand the shift is by analogy. In the early internet, the lasting value did not accrue to individual websites but to the protocols and infrastructure everything was built on, TCP/IP, the routers, the backbone. Crypto is going through a comparable hardening. Investors are increasingly treating the largest Layer-1s less like speculative bets and more like the cloud infrastructure of finance: the rails that tokenized assets, stablecoins, and on-chain markets all depend on.
This is why the trend lines up so precisely with what Wall Street has been doing. Morgan Stanley’s low-fee Ethereum and Solana ETF filings, Fidelity’s stablecoin reserve fund, and Franklin Templeton’s tokenization products are all bets on the same thing, not on a token mooning, but on the underlying networks becoming permanent financial infrastructure. When institutions tokenize Treasuries or settle payments on-chain, they need deep liquidity, network security, and proven decentralization, and only the largest networks currently offer all three. The capital concentration in the rankings is the market pricing that requirement in.
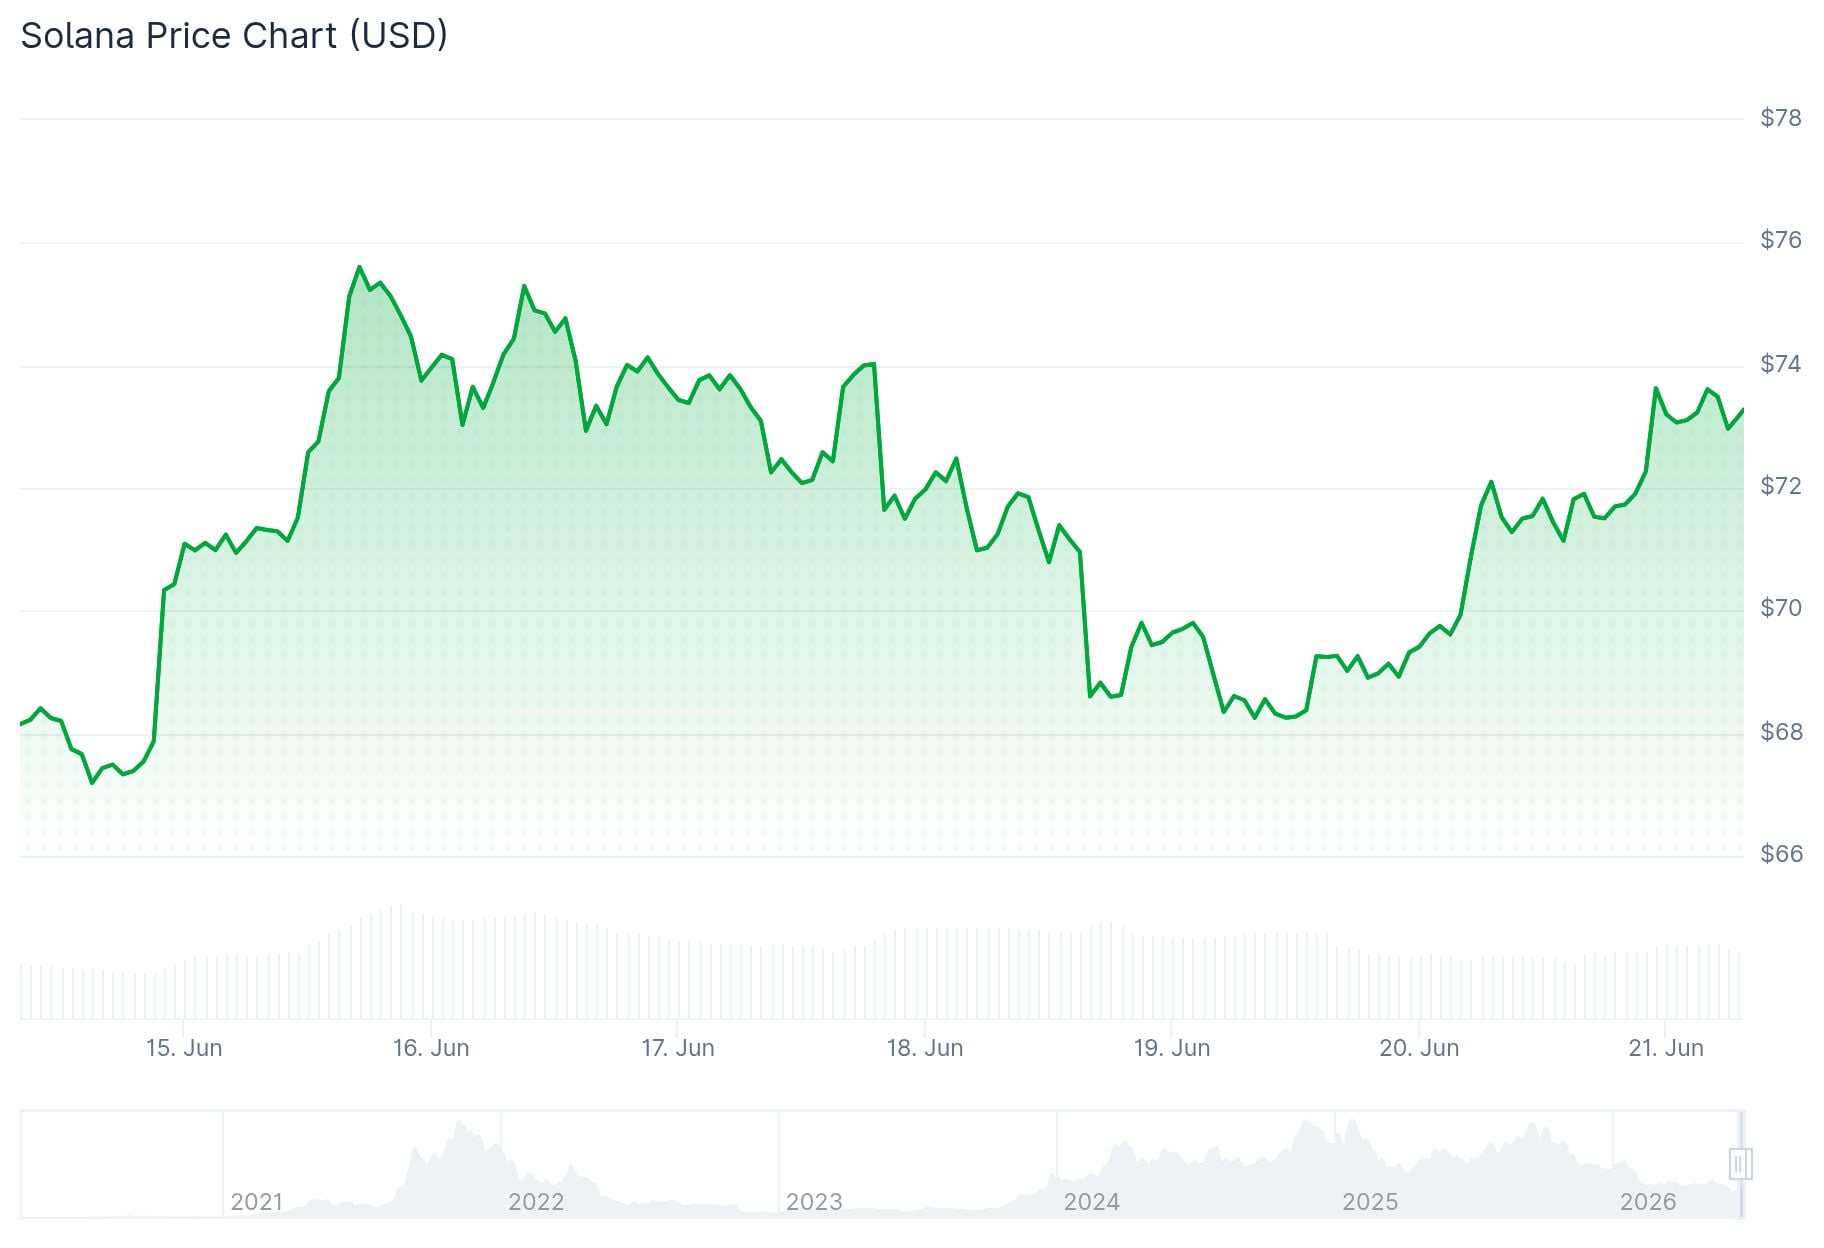
You can already see it in concrete moves. Stellar’s XLM jumped roughly 45% between June 15 and 18 on the back of real-world-asset tokenization, and Cardano is scheduled to launch its Leios scaling testnet on June 23. These are infrastructure stories, adoption and upgrades, not hype cycles.
Why Proof-of-Stake Is Pulling Ahead
The standout performer among the top sectors was Proof-of-Stake, up about 2.1% on the week, outpacing both Smart Contract Platforms and Layer-1s. The reason is structural, not sentimental. Staking is becoming crypto’s closest equivalent to a bond yield, and that reframes what a PoS asset is.
For institutions, this is the appealing part. A network that generates staking rewards is no longer a pure growth bet; it is an income-producing instrument. Grayscale’s research captures the effect cleanly: since staking launched in 2022, Ethereum’s price rose, but the total return from holding staked ETH was 119%, the gap being the yield. As traditional financial products begin baking staking rewards into their structures, the recent ETF filings being the obvious example, the networks that support staking gain a feature that maps directly onto how institutions already think about returns.
The Risks the Rankings Don’t Show
A note of caution is warranted, because “infrastructure” reads as safe and that word can mislead. Concentrating in foundational networks reduces some risks, the binary blow-up risk of a small speculative token, but it does not remove them. These networks carry specific exposures worth naming: bridging risk, where the cross-chain bridges connecting ecosystems have repeatedly been the single largest source of exploits in crypto; governance centralization, where a small set of large validators or token holders can quietly concentrate control of a supposedly decentralized network; and liquidity fragmentation, where activity spread across competing Layer-2s and rival chains thins out the depth on any single one. A Layer-1 is safer than a meme coin in the way a blue-chip stock is safer than a penny stock, which is to say relatively, not absolutely.
There is also concentration risk in the trend itself. When most capital crowds into a handful of sectors, those sectors can move together, and a regulatory or technical shock to the category does not spare the leaders. Diversification of narrative is not the same as diversification of risk. And the bedrock itself can move: this trend is vulnerable to developer migration, because if a newer, faster chain solves the scalability trade-offs better than today’s incumbents, the capital that looks settled could shift faster than current market caps suggest.

How to Track the Trend Yourself
The useful part of a shift like this is that it is measurable, and a reader does not have to take the rankings on faith. The metrics that actually matter are the ones that filter out market noise rather than echo it, the reads that show whether usage is real and whether it holds up when prices fall:
Total Value Locked (TVL): how much capital is actively deployed in a network’s applications. It is worth more than raw price action because it measures real usage, and the sharper signal is “stickiness,” whether assets stay locked in a protocol even through a market drawdown rather than fleeing at the first dip. Daily active addresses: a proxy for genuine user activity and retention, harder to fake than market cap. Developer activity: ongoing code commits and developer headcount, which signal whether builders are committing to an ecosystem long term. Staking ratio: the share of a PoS network’s supply locked in consensus; a high ratio points to network security and holder conviction. Stablecoin and RWA growth: rising stablecoin issuance and tokenized-asset integrations on a network show institutions actually using it.The throughline of 2026 keeps reasserting itself: capital is hardening around the core infrastructure of the digital-asset economy. Rather than chasing isolated token stories, the largest pools of money are positioning around the networks and staking ecosystems expected to carry tokenization, stablecoins, and on-chain finance into the mainstream. The rankings are not predicting which token wins. They are showing where the market believes the foundation is being poured.
The post Why the Biggest Money in Crypto Is Parking in Layer-1s appeared first on Coindoo.


 Bengali (Bangladesh) ·
  English (United States) ·