
 2 months ago
16
2 months ago
16 
This growing “HODL wave” reflects increased conviction among investors, as they choose to hold rather than sell—even with Bitcoin trading above $100,000. The long-term holder behavior, especially among those keeping coins untouched for years, suggests mounting expectations for further price appreciation.
Historically, similar patterns have preceded major bull runs. Long-term holding reduces available supply on exchanges, creating potential upward price pressure when demand increases. Combined with recent whale accumulation and strong institutional inflows, this data could signal a bullish backdrop for BTC heading deeper into 2025.
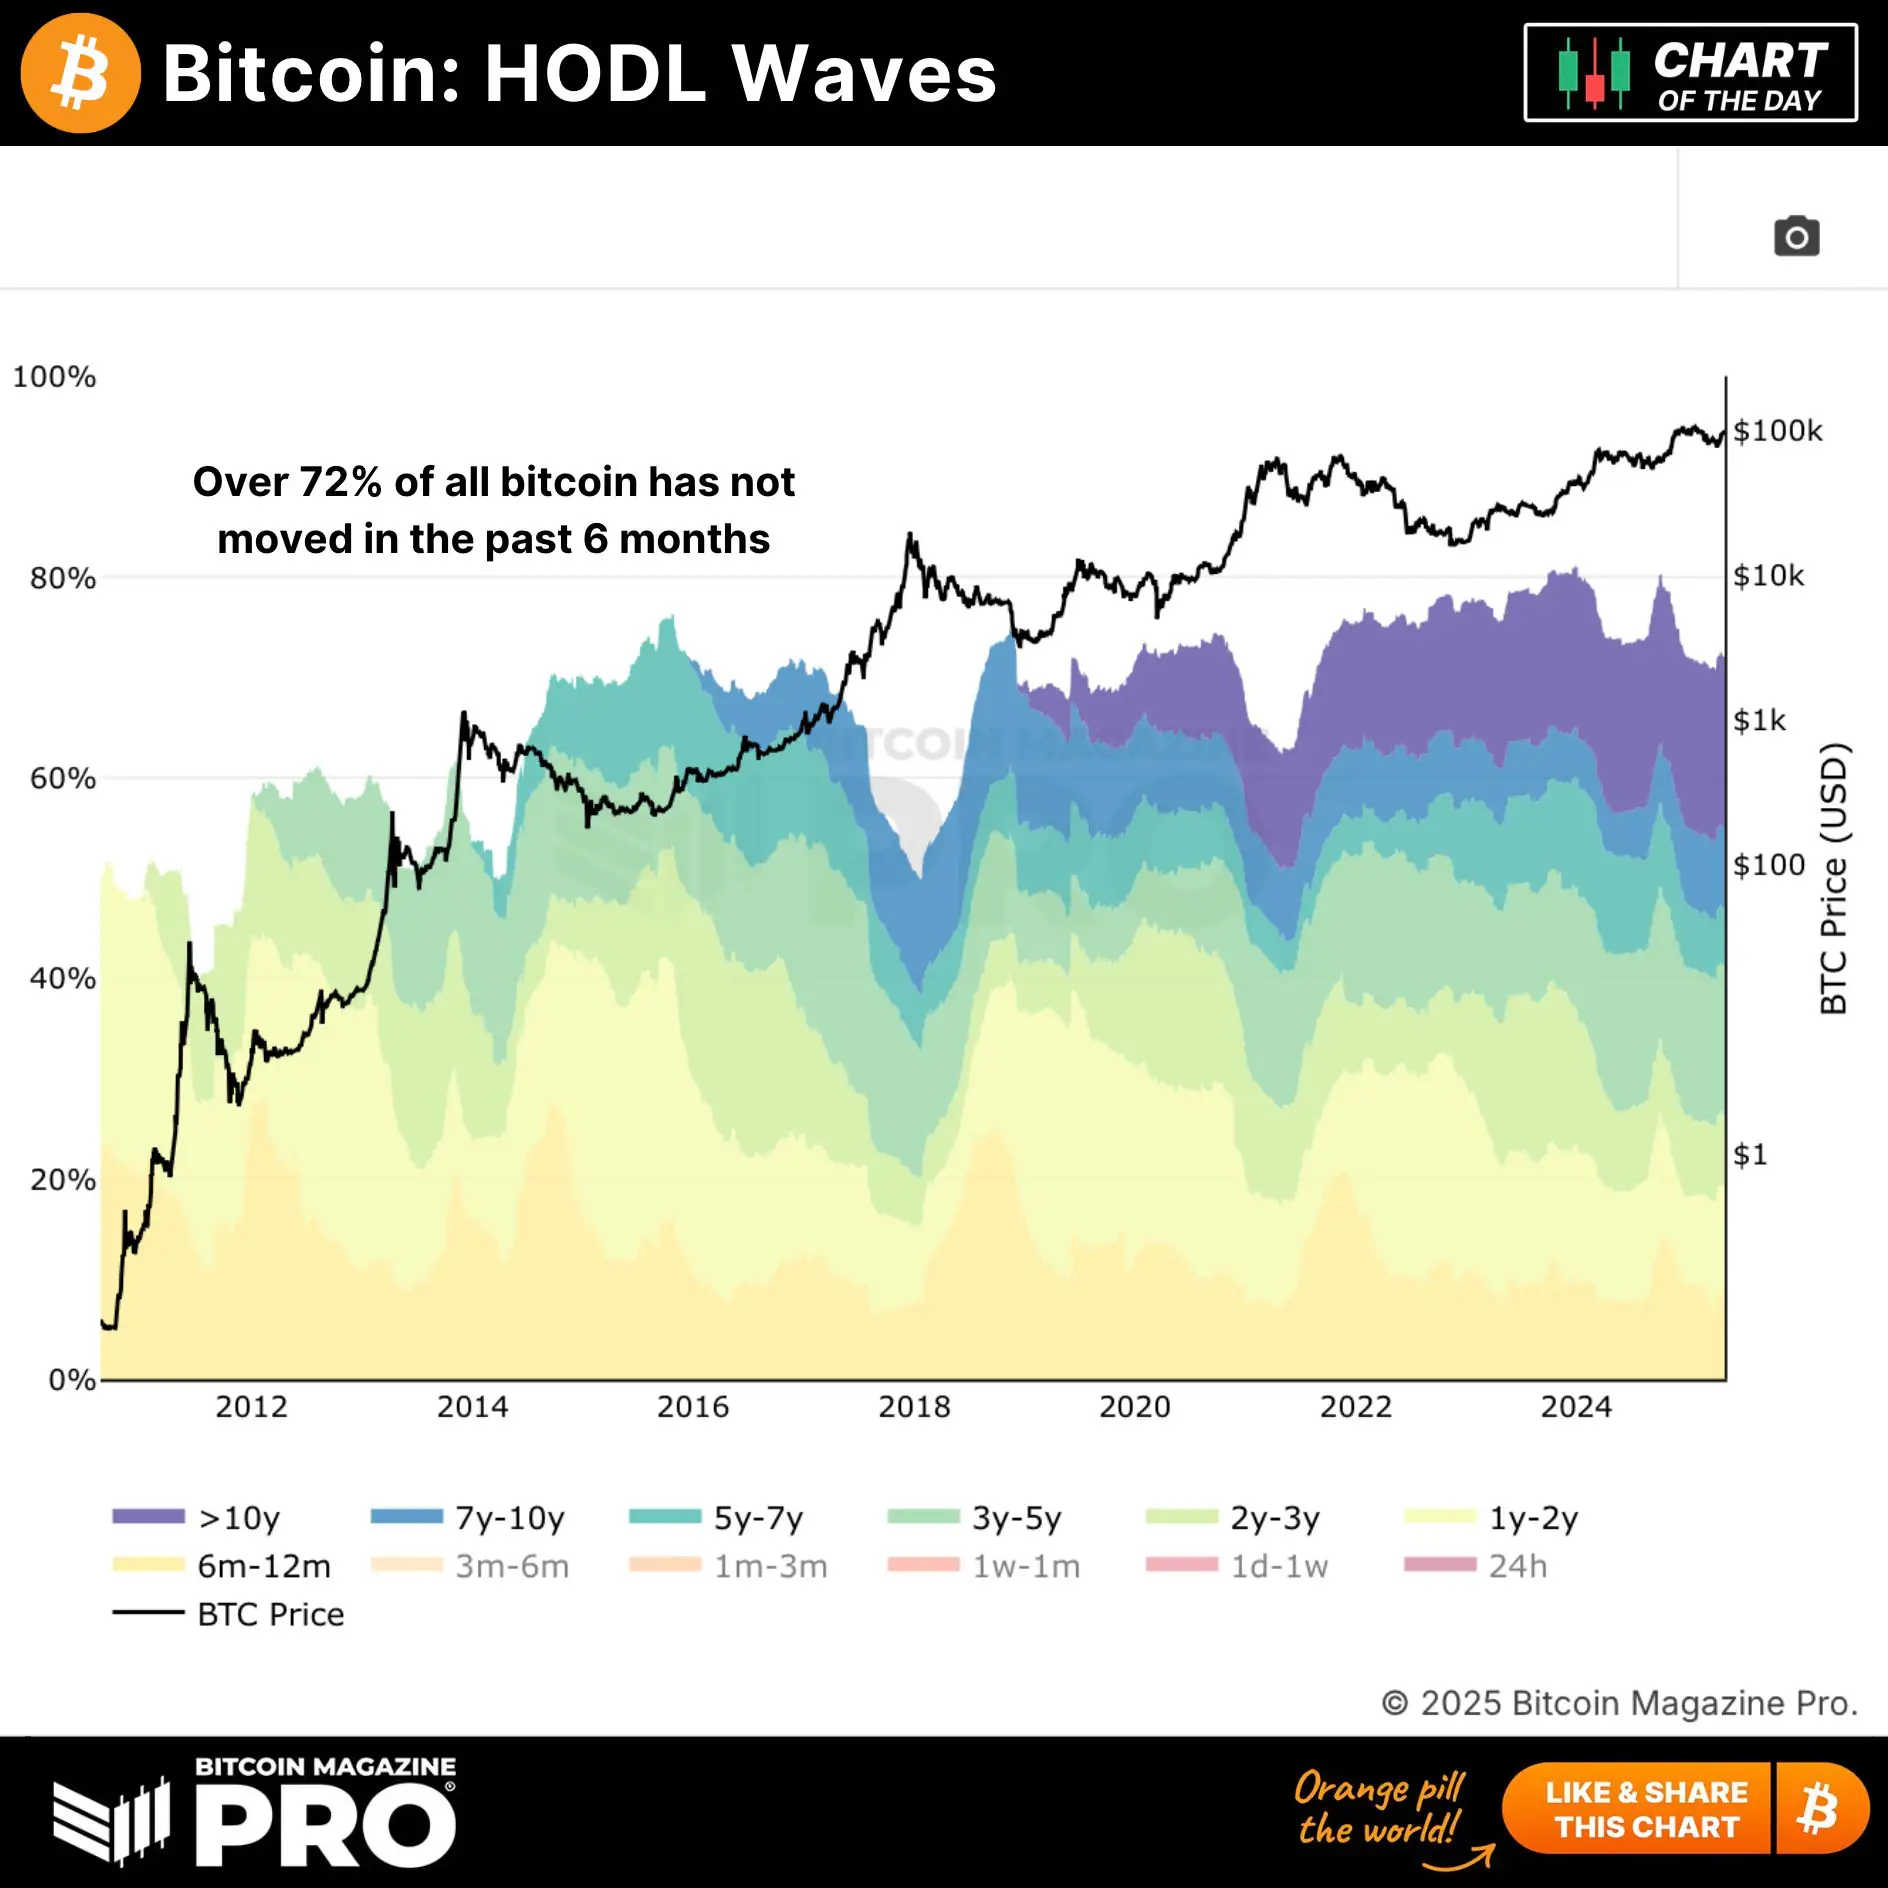
The HODL Waves chart visually represents the age distribution of Bitcoin held in wallets, categorized by how long each portion of BTC has remained unmoved. Each color band reflects a specific holding period—ranging from less than 24 hours to over 10 years. The thicker the band, the more Bitcoin is held in that time frame.

The chart shows that as of 2025, more than 72% of all Bitcoin hasn’t moved in over six months, with notable accumulation in longer-term bands like 1–2 years and 2–3 years. This suggests a strong trend of long-term holding, indicating reduced selling pressure and heightened investor conviction.
The post This Crypto Indicator Suggest we Are in For a Mega Bull Run appeared first on Coindoo.


.jpg.webp?itok=1zl_MpKg)


 Bengali (Bangladesh) ·
  English (United States) ·