
 1 month ago
34
1 month ago
34 

With current consolidation near $0.36, traders are watching key levels closely to determine if this could mark the start of a larger cycle-based play.
W Pattern Formation Hints at Bullish Momentum
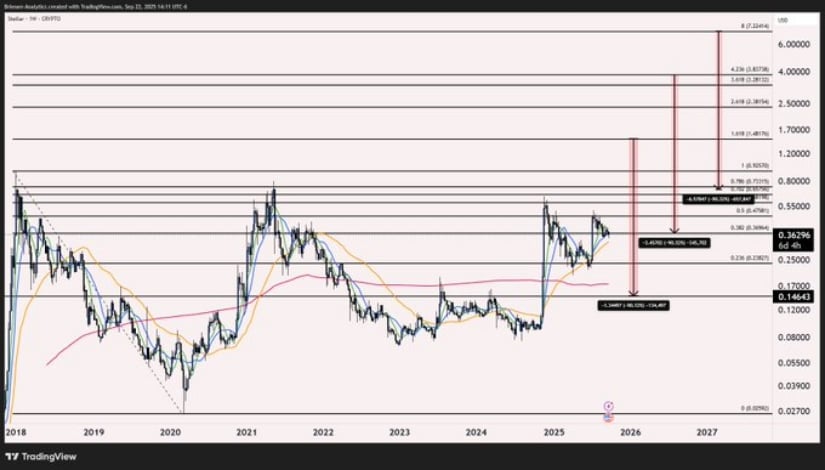
According to analyst CryptoCharged on X, the token is attempting to secure a higher low as part of a W-shaped reversal pattern. The setup is visible across both the daily and weekly charts, signaling the potential for renewed bullish momentum.
Historical models based on Fibonacci extensions also suggest that while XLM has faced steep drawdowns in previous bear cycles, its current positioning could favor cycle-based trading opportunities rather than long-term holding.
Source: X
The analyst notes that if the asset rallies to the 1.618 Fibonacci extension, a subsequent 90% correction would still leave investors down around 58% from current levels.
However, if the token reached higher extensions like 4.236 or even 8.0, a 90% retrace could still result in breakeven or even a 2x return. This framework highlights the asymmetric risk-reward profile that the crypto offers at its current valuation.
Market Data Shows Solid Liquidity Despite Weakness
Additionally, BraveNewCoin data shows Stellar is currently trading at $0.36, down 1.98% in the last 24 hours, giving the project a market capitalization of $11.63 billion. Daily trading volume stands at $315 million, with over 31.8 billion tokens in circulation.
Despite the modest price decline, the healthy liquidity profile underscores strong market participation, suggesting that the token continues to attract trader and investor interest within the top-25 cryptocurrencies by market rank.
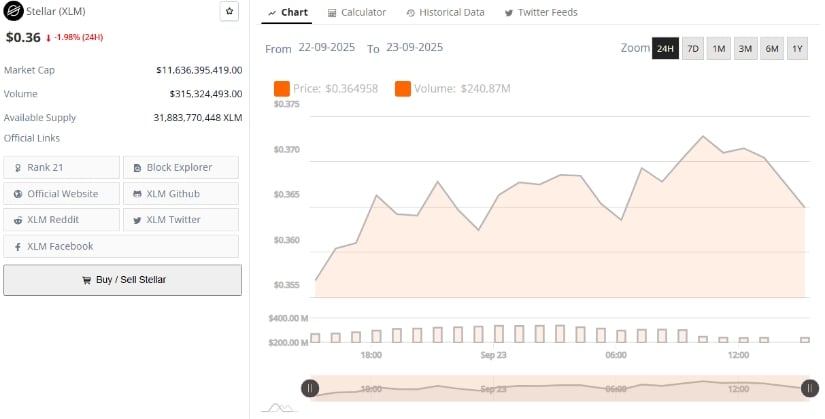
Source: BraveNewCoin
The broader market structure indicates that while the token has struggled to maintain momentum in recent sessions, its ecosystem and trading depth remain resilient. This aligns with the cycle-based outlook, where short-term volatility could be paving the way for more significant upside opportunities in the longer term.
Technical Indicators Signal Mixed Short-Term Outlook
At the time of writing, XLM/USDT is trading at $0.3688, posting a modest 0.14% daily gain according to TradingView data. However, indicators point to continued caution.
The MACD line (-0.0024) is hovering just below the signal line (-0.0015), while the histogram prints at -0.0010, signaling weak momentum. Meanwhile, the Relative Vigor Index (RVI) stands at 49.17, below its moving average of 55.72, suggesting fading bullish conviction.
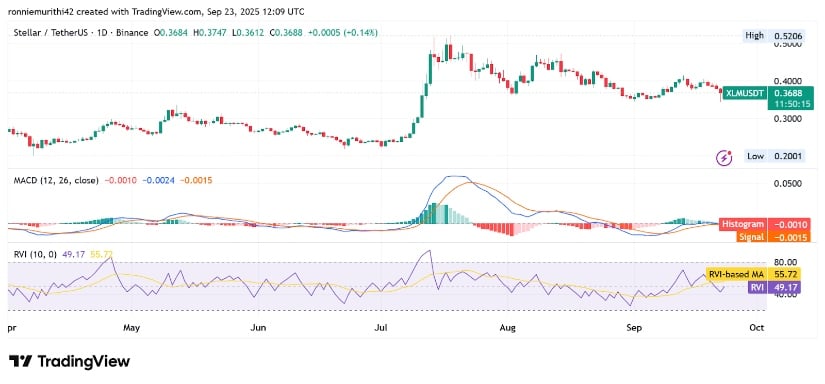
Source: TradingView
These readings reflect a market still in consolidation, with buyers and sellers battling for control. If the asset manages to hold above the $0.35 support zone and push toward the $0.40–$0.42 resistance range, it could confirm the W pattern outlook and strengthen bullish momentum. Conversely, a breakdown below $0.35 may delay recovery prospects and invite further downside.


 Bengali (Bangladesh) ·
  English (United States) ·