
 2 months ago
20
2 months ago
20 
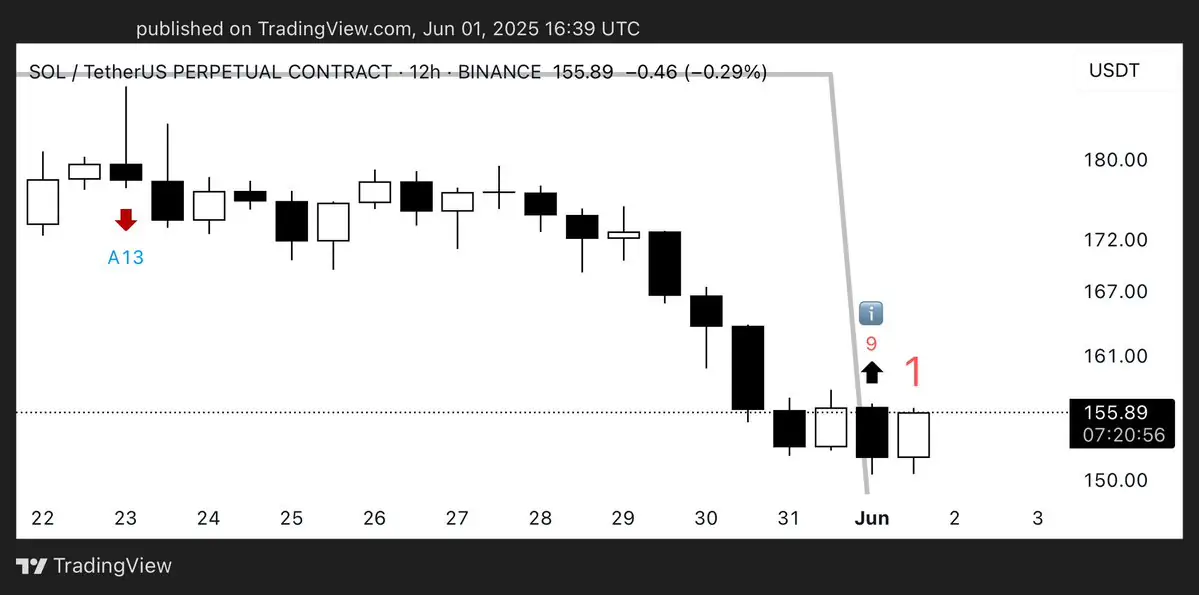
According to market analyst Ali Martinez, the TD Sequential indicator on the 12-hour chart has triggered a buy signal, suggesting a potential trend reversal after a recent downtrend.
TD Sequential Buy Signal Triggers Hope
The TD Sequential indicator, known for spotting trend exhaustion, issued a “1” green candle following a nine-count setup—often a signal that selling momentum may be waning. Historically, this setup is used by traders to identify early stages of a price recovery.
The signal comes after a series of declining candles, with SOL reaching as low as $150 before showing early signs of stabilization. If the TD pattern plays out, Solana could witness a short-term rally in the coming sessions.
Current Price and Market Overview
As of June 2, 2025, Solana is trading at $157, down roughly 5.3% over the past year. The token holds a market cap of $82.31 billion, ranking it as the sixth-largest cryptocurrency by market value. Despite recent volatility, SOL has seen a slight 0.93% uptick in the past 24 hours.
24-hour trading volume stands at $2.56 billion, with a volume-to-market cap ratio of 3.11%, reflecting healthy liquidity.
Price Action and Outlook
Over the last 12 months, SOL has seen significant price swings, with peaks above $250 and lows near $100. The current price sits below the yearly average, indicating room for upward movement if sentiment improves.
If the TD Sequential signal holds, traders could see SOL retest resistance zones around $165 and possibly higher. However, further confirmation and broader market support will be key for sustained momentum.
Conclusion
Solana’s technical setup suggests a possible rebound may be in play. With the TD Sequential indicator flashing a buy signal and short-term sentiment turning, traders and investors are watching closely to see if SOL can break out of its recent slump.
The post Solana (SOL) Shows Signs of Rebound as Buy Signal Emerges on 12-Hour Chart appeared first on Coindoo.


.jpg.webp?itok=1zl_MpKg)


 Bengali (Bangladesh) ·
  English (United States) ·