
 1 month ago
16
1 month ago
16 
According to a recent chart shared by prominent analyst Ali Martinez, Solana has been forming a classic “cup and handle” pattern—a bullish technical formation that often precedes significant upward price moves.
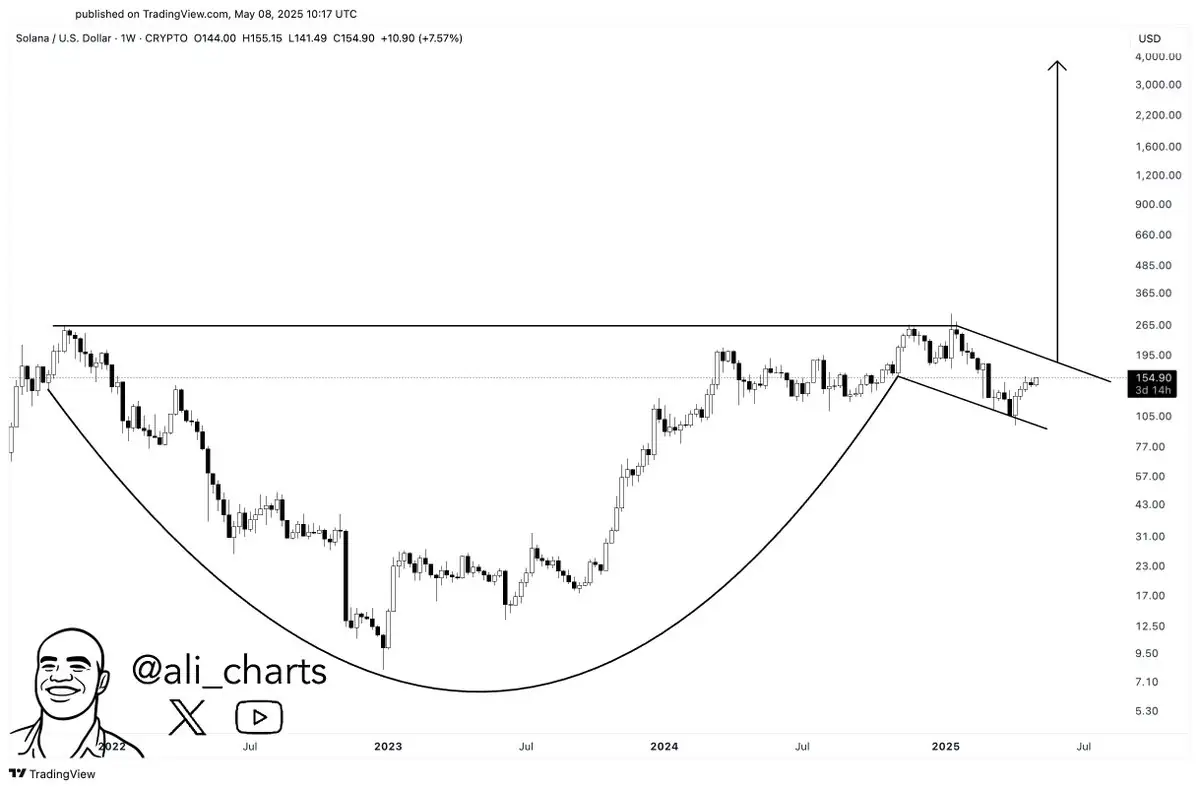 The pattern spans over two years, beginning after the 2022 market downturn and showing steady recovery through 2023 and 2024.
Currently trading around $154, Solana is attempting to push through a descending resistance line that caps the handle portion of the formation.
If price action can break above this consolidation and decisively clear the psychological $200 barrier, the setup suggests the potential for explosive upside. The vertical arrow on the chart hints at a substantial target, possibly reaching new all-time highs far beyond $365, and into the four-figure territory.

This technical setup aligns with growing optimism around Solana’s ecosystem expansion and increasing adoption in decentralized applications and NFTs. However, traders are advised to monitor volume and confirmation signals, as false breakouts can lead to rapid reversals.
If SOL does manage to break out with conviction, it could mark the beginning of a major upward leg in its price cycle—potentially positioning SOL as one of the leading performers of this bull market.
The post Solana Is About to Explode? Why Breaking $200 Could Send Prices Skyrocketing appeared first on Coindoo.


.jpg.webp?itok=1zl_MpKg)


 Bengali (Bangladesh) ·
  English (United States) ·