
 1 month ago
18
1 month ago
18 
According to his chart, SOL confirmed a breakdown from a bear flag pattern after forming a double top near the $188 level. The chart identifies key horizontal support levels, with a short-term price target of $142 now in play.
The breakdown reflects an 8.6% projected move lower from the pattern’s trigger point, emphasizing downside risk for SOL in the short term.
Traders who acted on the flag formation may already be in profit, as SOL trades below the lower trendline of the rising consolidation zone.

Altcoins Setting Up for a Major Rally?
Despite short-term bearishness in individual assets like Solana, Carl Moon also shared a bullish macro setup for the altcoin market. His chart of the total crypto market cap excluding Bitcoin (TOTAL2) shows a classic “cup and handle” formation, with the “handle” recently resolving inside a falling wedge — a typically bullish pattern.
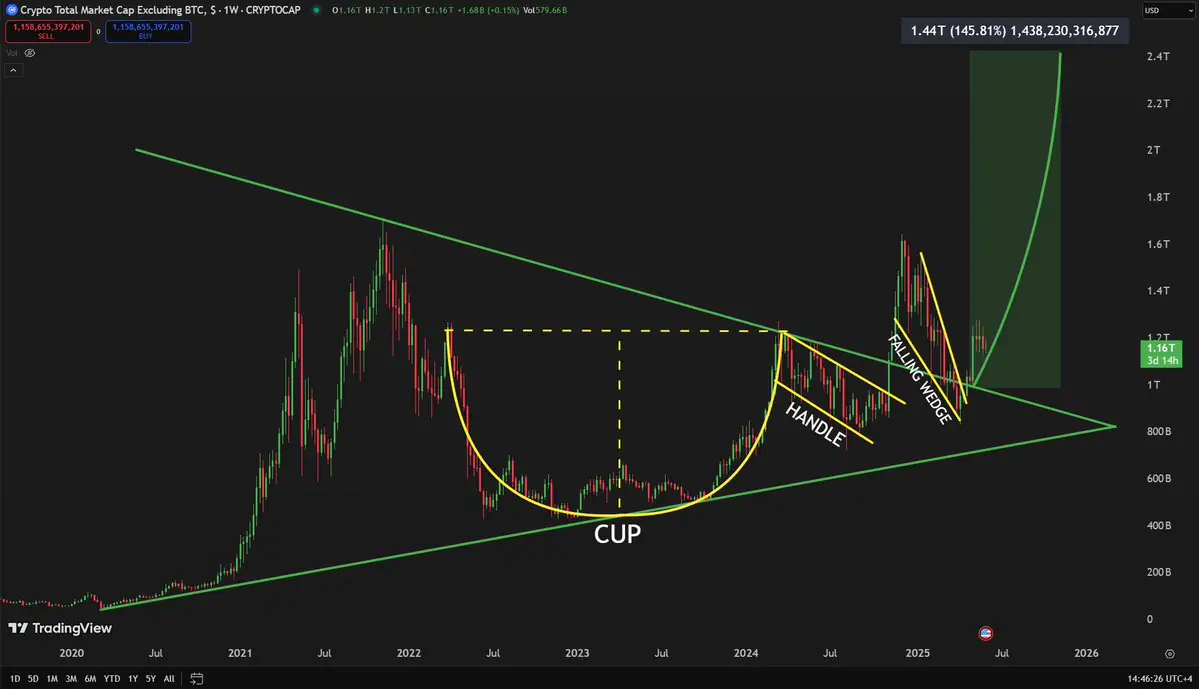
The long-term trendline remains intact, and the potential breakout above $1.4 trillion in market cap could ignite a broader altseason. The chart projects a possible surge toward $2.5 trillion if momentum accelerates as expected.
Technical Landscape Summary
SOL/USD: Double top + bear flag breakdown targeting $142. Altcoin Market: Cup and handle breakout setup suggests massive upside potential. Market Context: Micro bearishness (SOL) contrasts with macro bullishness (altcoins broadly).Carl Moon’s dual-perspective analysis serves as a reminder that while individual tokens may retrace, the broader altcoin sector may be poised for a powerful move — reinforcing the importance of timeframes and pattern context in crypto trading.
The post Solana Breakdown Signals Short Opportunity While Altcoin Rally Looms appeared first on Coindoo.


.jpg.webp?itok=1zl_MpKg)


 Bengali (Bangladesh) ·
  English (United States) ·