
 3 months ago
23
3 months ago
23 
According to the latest analysis from Alphractal, this shift marks a potentially pivotal moment in the current cycle.
What the Charts Reveal
1. Supply Held by Long and Short-Term Holders
In the first chart, Alphractal illustrates the behavior of Long-Term Holders (LTH) and Short-Term Holders (STH) relative to BTC’s price. Historically, STH supply (blue line) peaks shortly before cycle tops and then begins to decline — signaling the start of distribution.
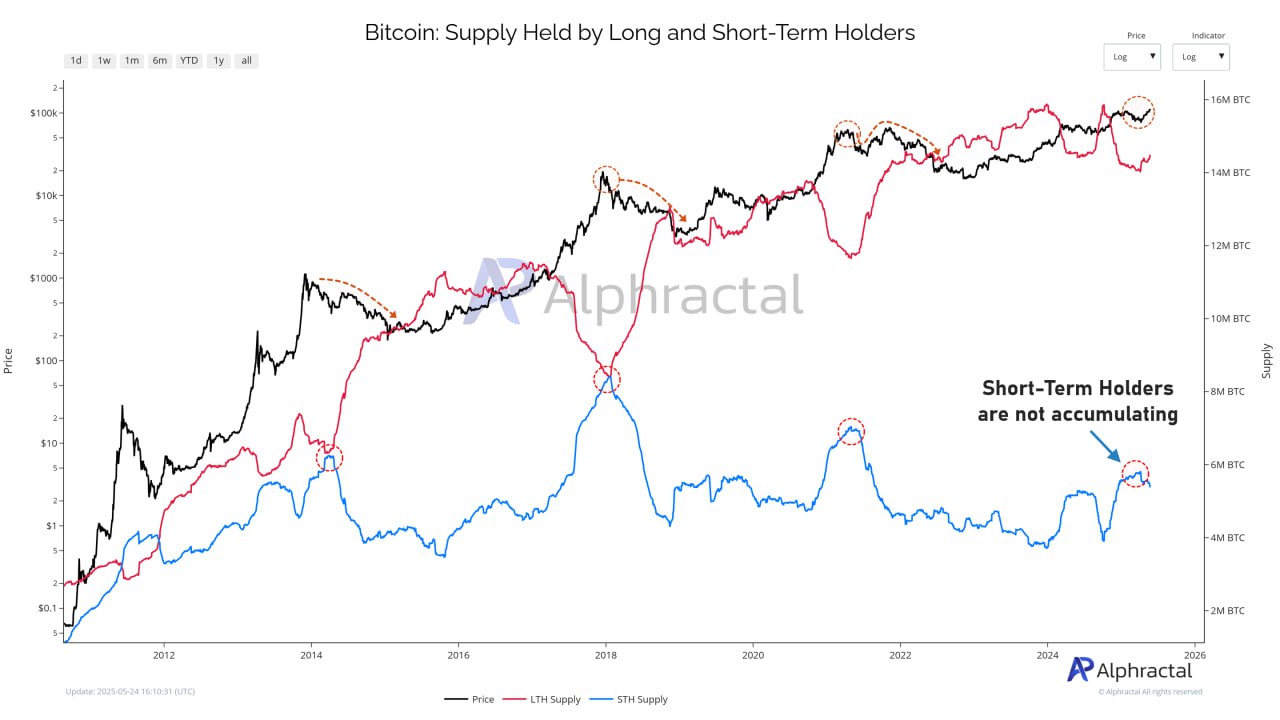
At present, we’re seeing a failure in STH accumulation, despite price increases.
The LTH supply (red line) remains elevated, suggesting that seasoned holders are not distributing aggressively yet.
This divergence implies increasing risk of a top, as newer market entrants are not buying as enthusiastically.
2. Accumulation vs Distribution of Short-Term Holders
The second chart captures the daily flow of coins between accumulation (green) and distribution (red) among Short-Term Holders.
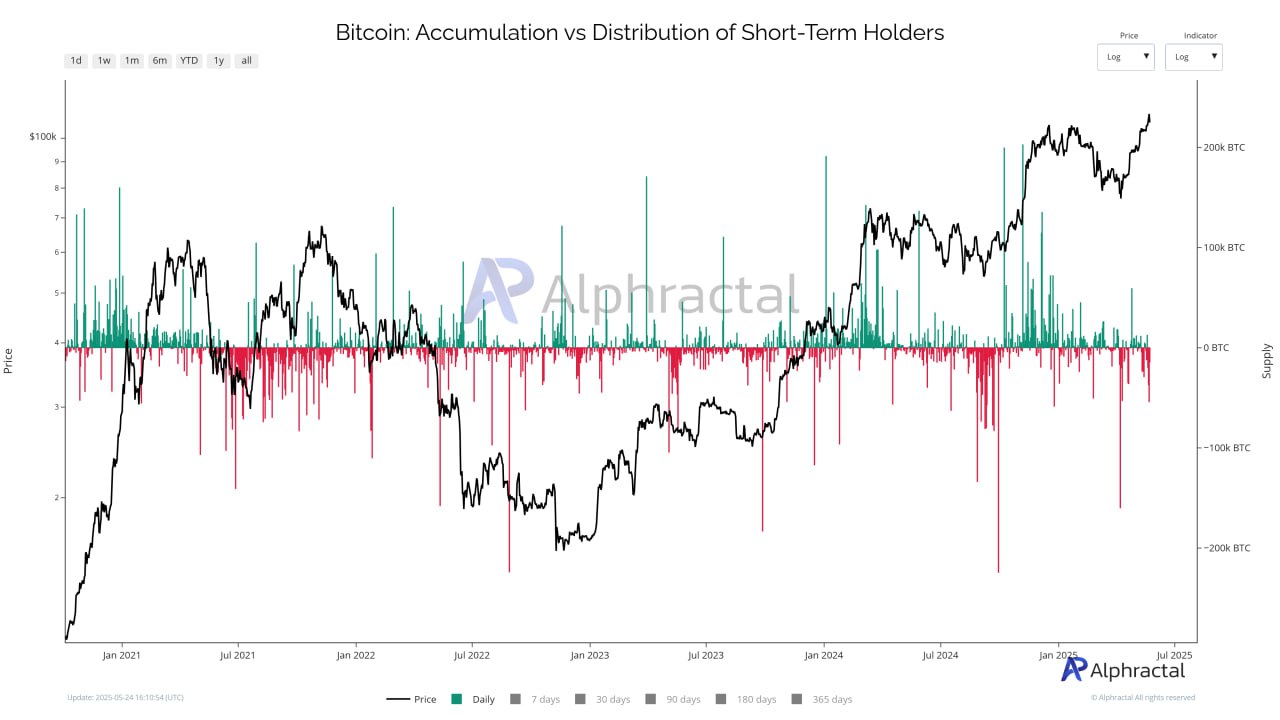
Since early 2025, distribution events have begun to dominate the on-chain flow, particularly during periods of price strength.
This dynamic reinforces the view that many recent buyers are opting to take profits, rather than accumulate further, despite upward price momentum.
3. Realized Price Comparison: LTH vs STH
The third chart is perhaps the most insightful from a macro perspective. It compares the realized price (average cost basis) of LTHs and STHs.
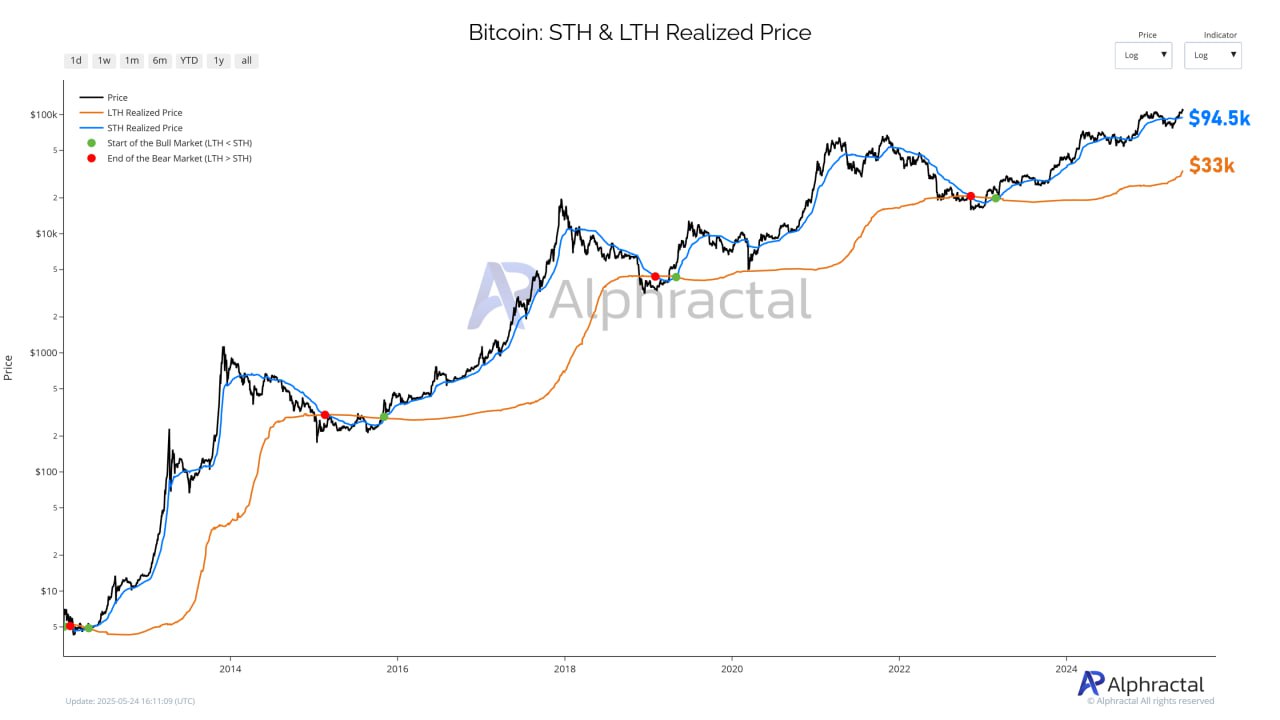
As of now:
STH Realized Price = $94.5K LTH Realized Price = $33KThese levels represent critical psychological and technical boundaries:
STH Realized Price acts as a near-term support: if the market dips below it, many STHs would be underwater, potentially triggering panic selling. Meanwhile, the LTH Realized Price continues its steady ascent, reflecting long-term confidence and lower risk exposure.
Onchain Curiosity
A recurring pattern highlighted by Alphractal: Every time the STH Realized Price crosses above the LTH Realized Price, a new bull market has followed. This powerful on-chain signal confirms the importance of realized price metrics in identifying macro shifts.
What’s Next?
While STHs are now distributing and historical signals point to a late-stage bull cycle, it’s crucial to remember that Bitcoin reached new all-time highs in 2021 even amid similar distribution behavior. So, while current signals hint at a cooling off period, the market may still have upside potential.
That said, macro on-chain patterns and halving symmetry suggest a potential significant correction could begin after October 2025. Investors should remain cautious and pay close attention to supply dynamics.
Conclusion
The charts from Alphractal paint a clear picture: Short-Term Holders are cashing out, and the market may be approaching the late stages of this cycle. However, Long-Term Holders remain steady, and macro indicators allow for a final upward push.
In such a nuanced environment, on-chain analytics proves to be a powerful tool for understanding investor behavior beneath the surface.
The post Short-Term Holders Are No Longer Accumulating Bitcoin, According to Latest Analysis appeared first on Coindoo.


.jpg.webp?itok=1zl_MpKg)


 Bengali (Bangladesh) ·
  English (United States) ·