
 1 hour ago
9


Quant’s recent price recovery has coincided with renewed buying activity and growing attention to Quant Network’s role in institutional tokenized deposit infrastructure.
Market data recorded QNT near $216 on October 26, following a 13.63% daily gain, after the asset had fallen toward $174–$178 during the previous sessions. The rebound has strengthened the short-term technical picture, although resistance above current levels could determine whether the recovery develops into a broader rally.
QNT Price Prediction: Key Technical Levels to Watch
Quant’s daily chart presents a cautiously constructive outlook. The token is trading above its 50-day and 100-day moving averages, which remain below the current price and indicate that the broader recovery structure is intact. However, shorter-term momentum indicators suggest that buyers have not yet established a decisive upward trend.
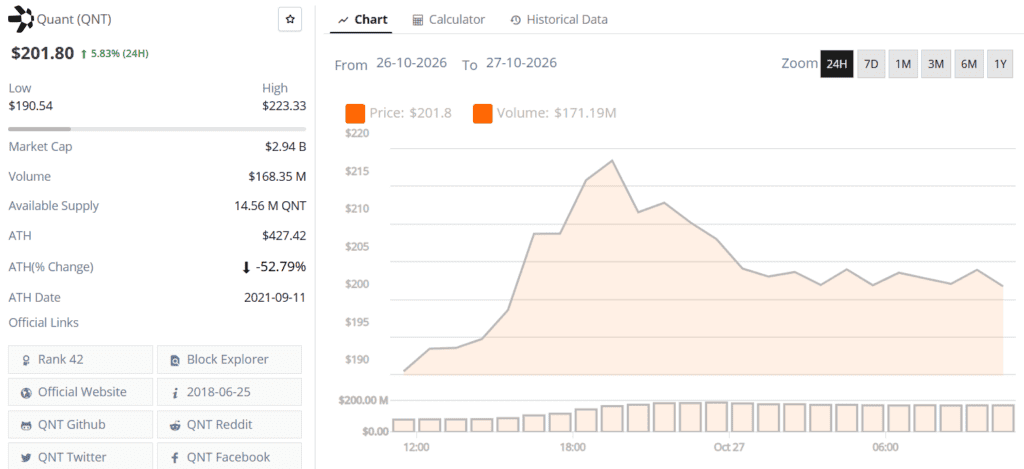
Quant (QNT) price chart. Source: Brave New Coin
The Relative Strength Index (RSI) has remained around neutral territory, while the Moving Average Convergence Divergence (MACD) has shown mixed momentum. These readings suggest that QNT has room to advance without entering clearly overbought territory, but they do not independently confirm another sustained rally.
The $198–$203 region is an immediate area to monitor as QNT attempts to establish support above $200. A sustained move through the $211–$216 resistance zone would provide a stronger indication that buyers are regaining control. Beyond that level, the next potential resistance areas sit around $225–$230, followed by the $250–$263 region.
On the downside, $182–$190 represents an important support zone. A breakdown below $182 could expose the mid-$170s, where QNT recently attracted buying interest. Further weakness could bring the lower end of its broader trading range into view.
These levels remain conditional rather than guaranteed price destinations. Traders will need to assess whether trading volume and follow-through buying support any move beyond resistance.
QNT Breaks Falling Wedge, Putting $300 in Focus
An eight-hour chart analysis published by DigitalChartist on TradingView identified a breakout above a falling wedge resistance line, accompanied by increased trading volume. The pattern can signal a potential bullish reversal, although confirmation depends on whether the price maintains the breakout.
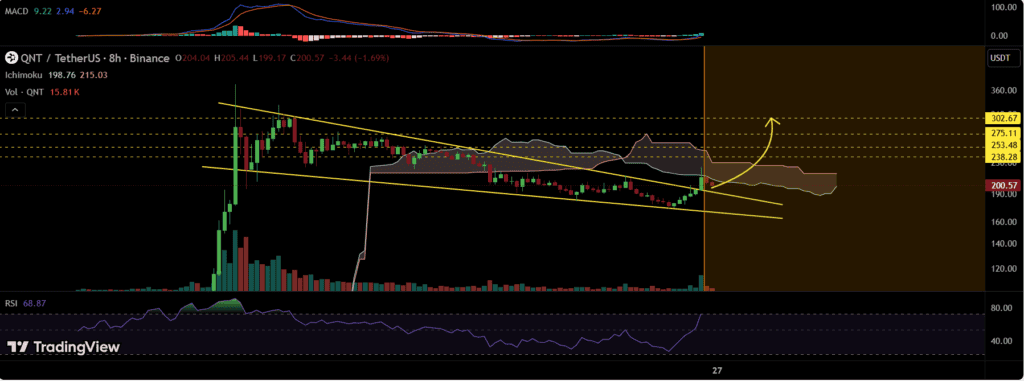
QNT has broken above the falling wedge resistance, with a confirmed breakout potentially targeting $238.28, $253.48, $275.11, and $302.67. Source: DigitalChartist on TradingView
QNT is now facing resistance around the Ichimoku cloud, which could limit further gains in the near term. A retest of the broken wedge boundary would not necessarily invalidate the bullish setup, provided the former resistance area holds as support.
DigitalChartist outlined potential upside targets at $238.28, $253.48, $275.11, and $302.67. These projections place the $300 level within the pattern’s potential recovery range, but QNT would first need to overcome several intermediate resistance zones.
The analyst’s targets should be treated as technical scenarios rather than forecasts with guaranteed outcomes. A rejection at the Ichimoku cloud or a return below the wedge breakout could weaken the setup and extend the current consolidation.
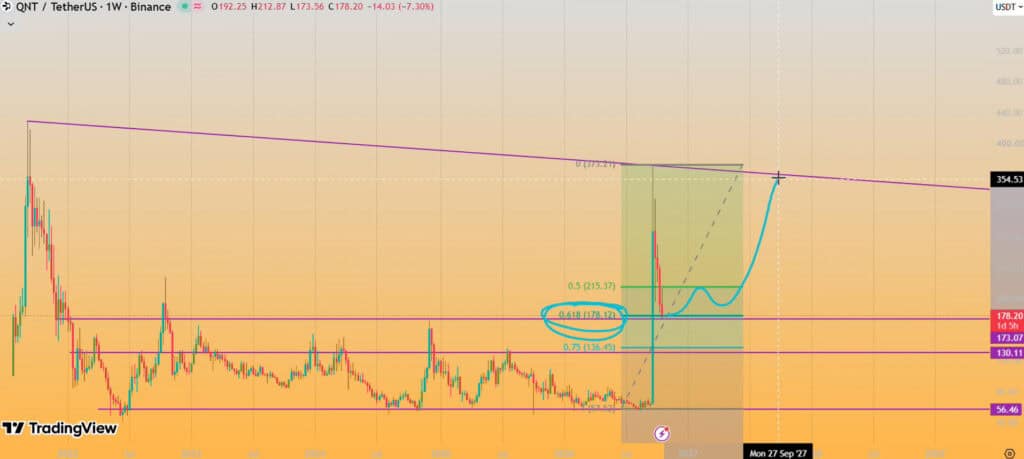
The TradingView video highlights QNT’s descending trendline, Fibonacci levels, and projected recovery toward the $373 swing high and beyond. Source: @gandreou007 via X
Another technical perspective came from crypto analyst @gandreou007, who shared a weekly chart analysis on October 25. The analyst identified the $178.12 Fibonacci retracement level, corresponding to the 0.618 ratio, alongside support near $173. The analysis suggested that defending this region could support a bullish recovery.
The analyst also identified $130–$136 as a deeper support area if the lower levels failed. On the upside, the analysis pointed to $215 as an important recovery threshold, with the $350–$360 region representing a broader resistance barrier before a potential move toward $500.
Together, the chart analyses identify several hurdles between QNT’s recent recovery and a move beyond $300. The immediate test remains whether the token can sustain its position above $200 and break through the $211–$216 resistance zone.
Quant’s Institutional Adoption Adds to Market Interest
Beyond technical indicators, Quant’s involvement in institutional payment infrastructure provides another development for investors to monitor.
On September 24, The Clearing House announced that it had selected Quant to support its On-Chain Money Initiative, a proposed network designed to facilitate the clearing and settlement of tokenized bank deposits. Quant’s technology will provide interoperability, orchestration, and transaction management while connecting the network to existing payment systems, including RTP and CHIPS.
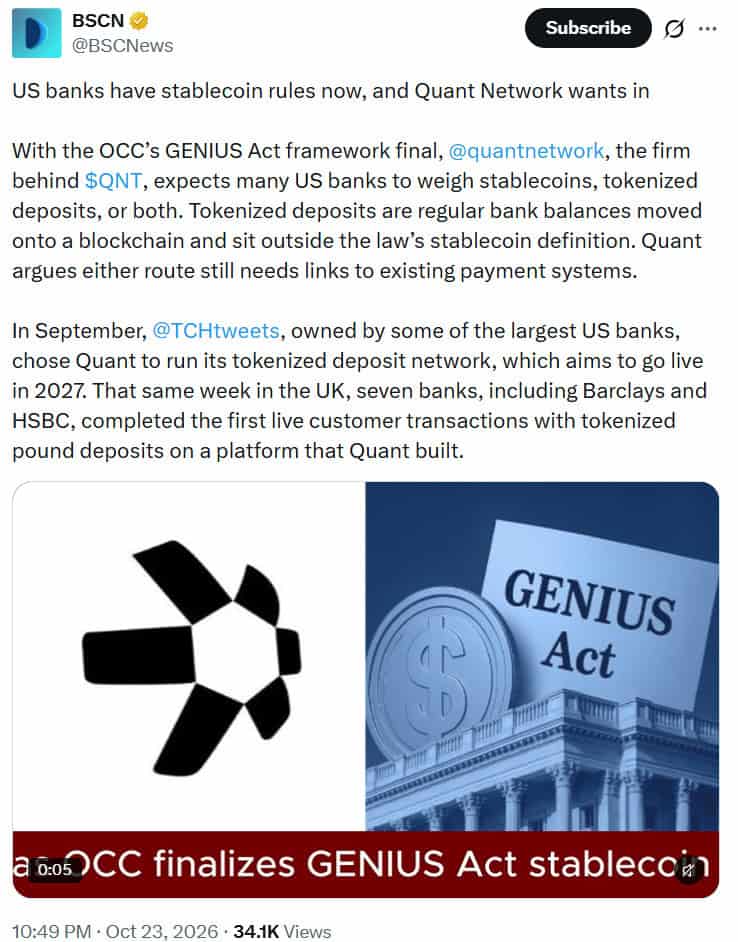
Quant Network was selected by The Clearing House in September 2026 to support a tokenized deposit network targeting launch in H1 2027, integrating with existing payment systems RTP and CHIPS. Source: @BSCNews via X
The network is expected to become available to participating financial institutions in the first half of 2027. Its intended applications include corporate treasury management, liquidity operations, and digital settlement.
Tokenized deposits are digital representations of bank deposits rather than conventional payment stablecoins. They can enable programmable transactions while remaining linked to deposits held within the banking system. Quant’s role in connecting these transactions with existing financial infrastructure could support demand for its technology if institutional adoption expands.
The development also comes amid changes to the US digital asset regulatory framework. On October 21, the Office of the Comptroller of the Currency finalized rules implementing the GENIUS Act for payment stablecoin issuers and certain related activities under its jurisdiction. The rules are scheduled to take effect on January 18, 2027.
Although this regulatory development provides broader context for institutional digital asset activity, it does not establish a direct catalyst for QNT’s price. The relationship between Quant’s enterprise business, adoption of its technology, and demand for the QNT token should be assessed separately.
QNT Price Outlook: Can Quant Sustain a Rally Beyond $300?
Quant’s recovery above $200 has improved its near-term technical position, while the falling wedge breakout has introduced potential upside targets extending toward $300. Nevertheless, resistance levels and mixed momentum indicators suggest that further confirmation is needed before a sustained rally can be established.
A decisive move above $211–$216 could strengthen the bullish case and bring $225–$230 into focus. If buying pressure continues, the $250–$263 area could become the next test before QNT approaches the $275–$303 range identified in the eight-hour chart analysis.
Conversely, failure to maintain support between $182 and $190 could undermine the recovery and expose the mid-$170s. A deeper decline would weaken the immediate bullish structure and shift attention toward lower support levels.
Quant’s institutional partnerships provide a longer-term development to watch, particularly as tokenized deposit infrastructure moves toward deployment. However, adoption timelines, market conditions, and actual demand for QNT remain important uncertainties.
For now, the key question is whether QNT can convert its rebound above $200 into a sustained breakout. A confirmed move through resistance would improve the technical outlook, while a failure to hold support would suggest that the latest recovery may remain part of a broader consolidation.


 Bengali (Bangladesh) ·
 English (United States) ·