
 1 hour ago
4
1 hour ago
4 
Here’s a breakdown of the recent market behavior and what it may suggest for traders and investors in the near term.
1. Downtrend and Consolidation Phase (April 27–30)
From April 27 to late April 30, PI experienced a consistent downtrend. Price action showed a sequence of lower highs and lower lows, falling from around $0.66 down to the $0.56 zone. Volume during this period remained moderate, suggesting a slow but steady distribution phase by sellers. Minor relief rallies occurred but failed to break resistance levels, indicating bearish control.
A sharp sell-off is particularly noticeable around April 29, when the price briefly dipped below $0.54. This sudden wick suggests either a liquidation event or a stop-hunt move before a reversal began forming.
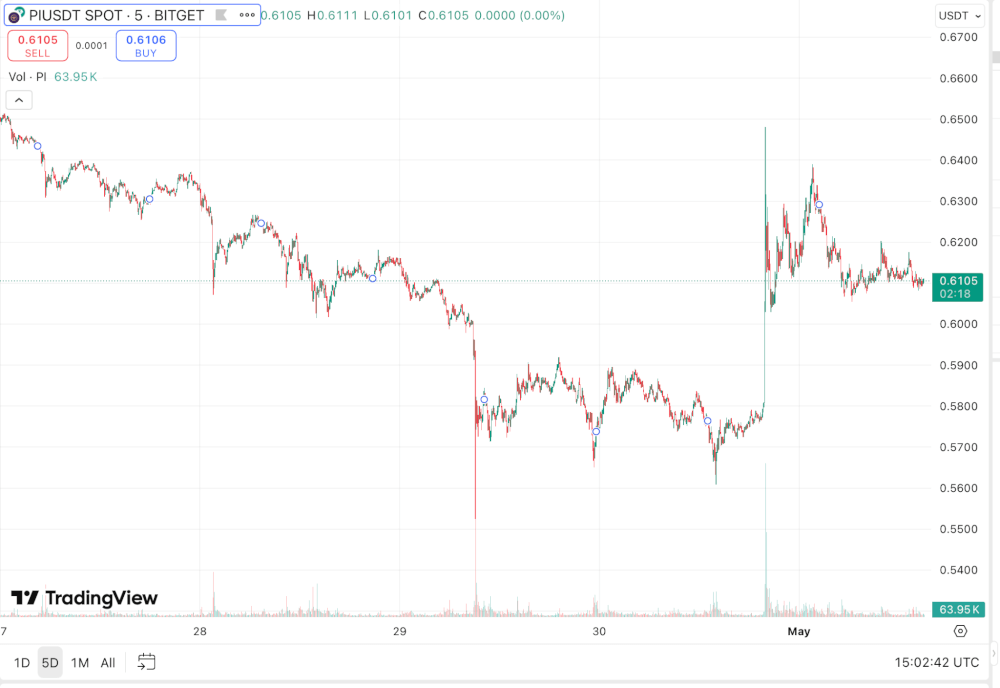
2. Reversal Spike and Momentum Shift (Early May 1st)
In the early hours of May 1st, a strong bullish breakout occurred, with a rapid surge in price from approximately $0.57 to over $0.64. This breakout was accompanied by a significant spike in volume, implying institutional buying or strong retail interest. This V-shaped recovery may have marked a shift in sentiment from bearish to bullish, at least in the short term.
Such sharp moves are often followed by a cooling-off period, and that’s exactly what transpired post-surge.
3. Sideways Movement and Support Formation (Mid May 1st)
Following the surge, the price settled into a consolidation range between $0.60 and $0.62. This range-bound behavior typically indicates indecision among traders, with neither bulls nor bears taking full control.
The current price is hovering around $0.6105, sitting in the mid-range of this consolidation zone. This level appears to be a developing support floor as the price respects this zone multiple times.

4. Volume & Market Sentiment
The volume profile shows a spike around the time of the surge, with a gradual decline afterward. This is typical in parabolic moves where initial excitement fades, followed by a cooling-off. If volume increases again during a retest of the $0.62–$0.64 zone, it could trigger a fresh breakout.
Key Technical Levels
Immediate Support: $0.6000 – Psychological and structural level. Stronger Support Zone: $0.5700 – Recent bounce zone pre-surge. Immediate Resistance: $0.6200–$0.6250 – Top of current consolidation. Major Resistance: $0.6400 – Post-surge high.Short-Term Outlook
Currently, PI/USDT appears to be in a cooling consolidation after a strong bullish reversal. A breakout above $0.6250 with volume confirmation could trigger a retest of $0.64 and potentially higher levels. Conversely, a breakdown below $0.60 may revisit the $0.57 support zone.
The post Pi Coin: What Happened to the Price in the Last Days and What to Expect appeared first on Coindoo.


 Bengali (Bangladesh) ·
  English (United States) ·