
 1 month ago
10
1 month ago
10 
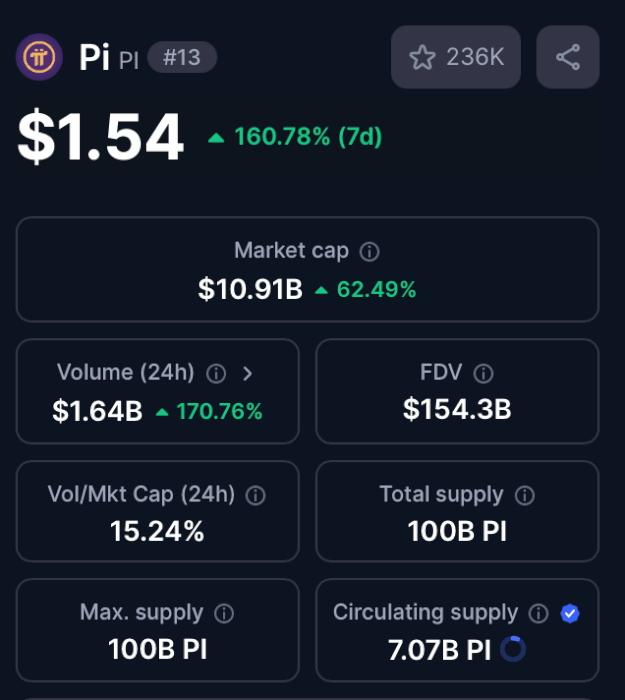
The move has caught the attention of traders and investors alike, as the coin gains momentum amid rising volume and market interest.
24-Hour Price Action
In just the past 24 hours alone, Pi Coin has jumped an impressive 60.78%, with prices soaring from sub-$1.00 levels to a local high of $1.5959 before pulling back slightly to current levels around $1.55. The 4-hour candlestick chart reveals a sharp vertical ascent, showing multiple green candles with growing volume—an indicator of strong buying interest.
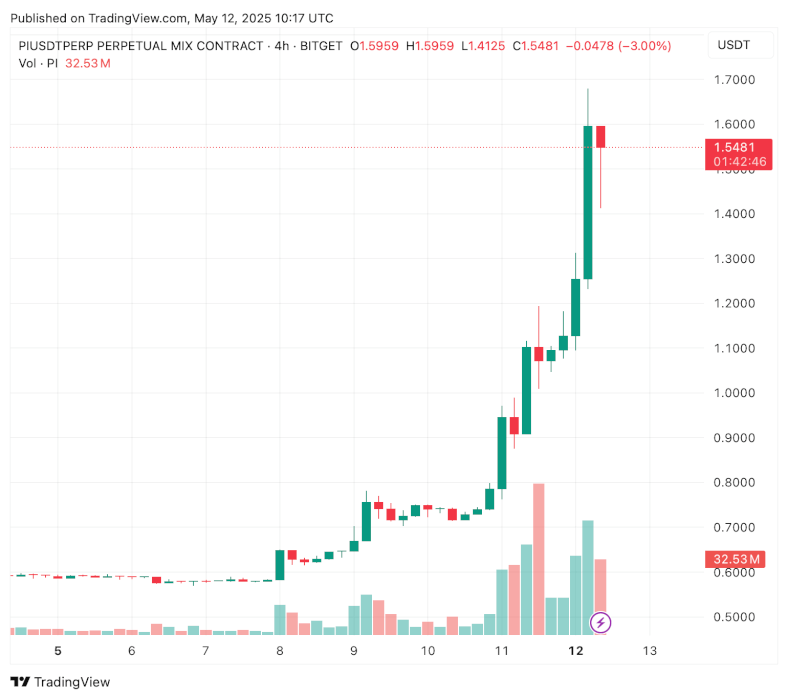
Key Support and Resistance Levels
Based on the 4H chart from Bitget:
Immediate Resistance: $1.60–$1.70This is where the price briefly topped out before seeing a slight pullback. If bulls reclaim and hold above this level, it could pave the way for a new leg up. Current Support Zone: $1.30–$1.40
This is the area where the price consolidated before the last breakout. Holding above this zone is critical for the bullish structure to remain intact. Major Support: $0.90–$1.00 A breakdown to this level would signal a loss of short-term momentum but could offer a buying opportunity for longer-term investors.
Volume Spike Signals FOMO
A noticeable increase in volume (31.38M as shown on the chart) suggests that retail and possibly institutional players are jumping in. This kind of volume often accompanies sharp breakouts and can lead to either strong continuations or quick corrections.

Outlook: Momentum vs. Correction
While the recent performance has been spectacular, traders should be cautious. Parabolic moves like this can result in volatile corrections. Monitoring volume and candle structure over the next few sessions will be crucial.
The post Pi Coin Surges Over 150% in a Week: Key Levels to Watch appeared first on Coindoo.


.jpg.webp?itok=1zl_MpKg)


 Bengali (Bangladesh) ·
  English (United States) ·