
 1 month ago
13
1 month ago
13 
Now, all eyes are shifting to the next potential point of interest: the $102,000 region, which appears to be a dense cluster of liquidation levels.
Liquidity Sweeps and Heatmap Signals
As shown in the Binance BTC/USDT liquidation heatmap, Bitcoin recently pierced through a band of brightly lit liquidity—suggesting that overleveraged longs were taken out or positions were closed at key breakout points. This is a common market mechanic in crypto: price often moves to clear excess leverage before resuming direction.
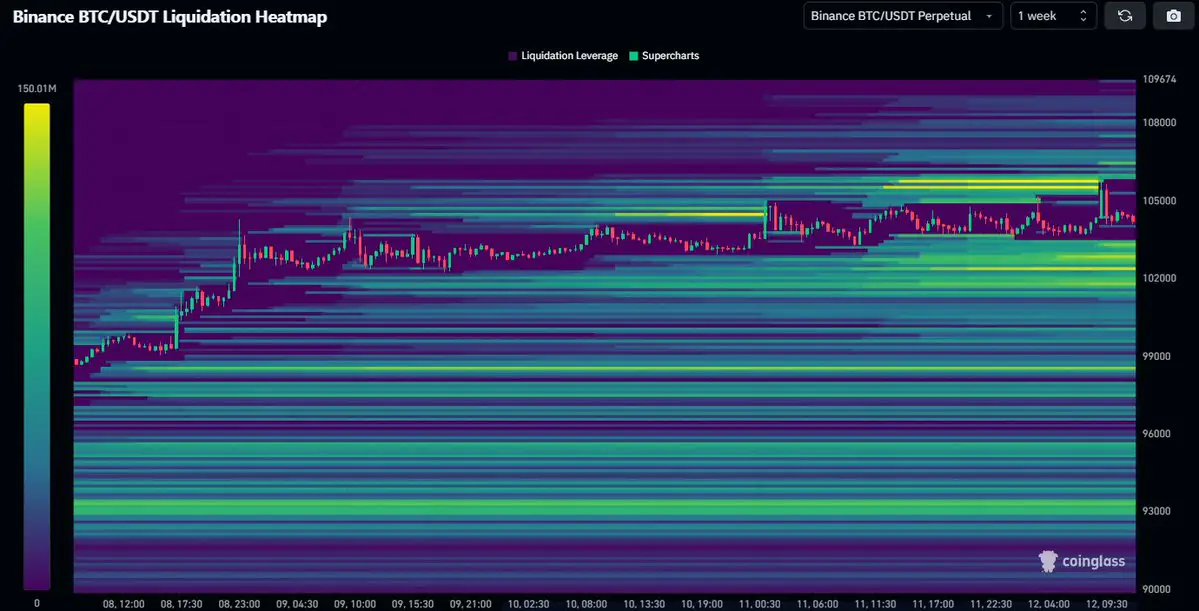
Daan Crypto Trades highlights this sweep as a short-term clearance of risk above. The next logical area for traders to monitor is the ~$102K zone, which has a heavy concentration of liquidation leverage zones below current price. The color-coded heatmap confirms this, with bright yellow and green bands stacked tightly around $102K—an indicator that this level holds significant trading interest.
What to Watch for at $102K
This $102K level could act as either a magnet for price or a reversal point, depending on how traders react. If BTC moves down into this area, it might:
Trigger more liquidations, offering a sharp but brief dip.
Serve as a bounce zone, if buyers absorb the pressure and flip the level into support.
Traders are advised to watch price action closely near that area before making decisions.

As Daan puts it:
“Could be a good level for some action. Depending on the reaction there you can reassess.”
Conclusion: Watch the Reaction, Not Just the Level
While the breakout above $105K cleared nearby liquidity, Bitcoin is not yet in the clear. With the $102K region
The post Mass Liquidations Hit Bitcoin—$102,000 Could Be the Next Trap! appeared first on Coindoo.


.jpg.webp?itok=1zl_MpKg)


 Bengali (Bangladesh) ·
  English (United States) ·