
 16 hours ago
3
16 hours ago
3 
With BTC now trading above $103,500, the same setup is forming again—prompting speculation that a significant correction or peak could be approaching.
The Pattern: Bearish RSI Divergence at Key Highs
The chart shows four previous instances (2014, 2018, 2021, and now 2025) where Bitcoin’s RSI (14-month) formed a lower high while price made a higher high—a classic bearish divergence. Each time, this signaled a local top, followed by significant corrections:
2014: RSI divergence preceded a bear market.
2018: RSI divergence aligned with a macro top.
2021: Another bearish divergence led to the multi-month downtrend.
2025: RSI is again turning down near 69 while price hits new highs.
A large finger emoji in the chart highlights the current RSI positioning, emphasizing a potentially critical moment in the market.
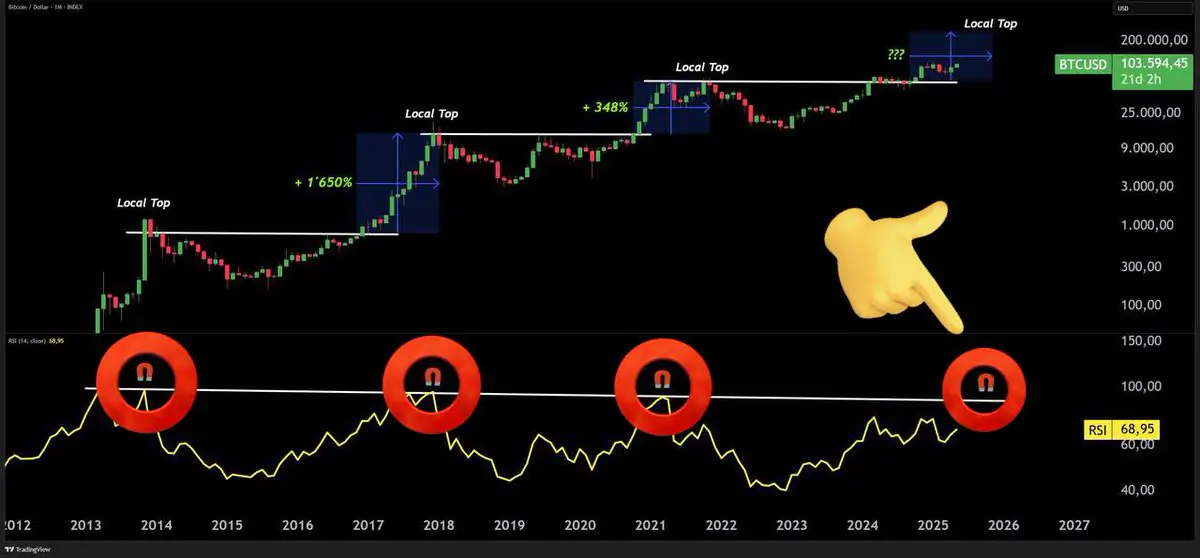
Price Outlook
The upper price boxes indicate past returns of 1,650% and 348% in previous cycles. With the 2025 price now nearing a local resistance level just above $100K, traders are watching closely to see if this RSI signal once again leads to a correction—or if Bitcoin can break the pattern and push toward new highs above $150K or even $200K.

Why It Matters
Technical patterns like this do not guarantee market reversals but serve as cautionary signals. With RSI nearing overbought levels and bearish divergence appearing again, risk management becomes more important—especially as euphoric sentiment rises in the space.
If the pattern holds, a pullback or temporary top may be imminent.
The post How to Spot a Bull Market Top, According to History appeared first on Coindoo.


 Bengali (Bangladesh) ·
  English (United States) ·