
 3 months ago
22
3 months ago
22 
A new analysis from prominent crypto chartist EGRAG CRYPTO suggests that XRP could be preparing for an explosive price rally, potentially reaching as high as $28.70.
Using a blend of historical data, Fibonacci projections, and technical patterns, the chart points to a bullish scenario reminiscent of XRP’s legendary breakout in 2017.
The chart, published on TradingView, examines XRP’s price action on a weekly scale. At the time of analysis, XRP was trading around $2.45.
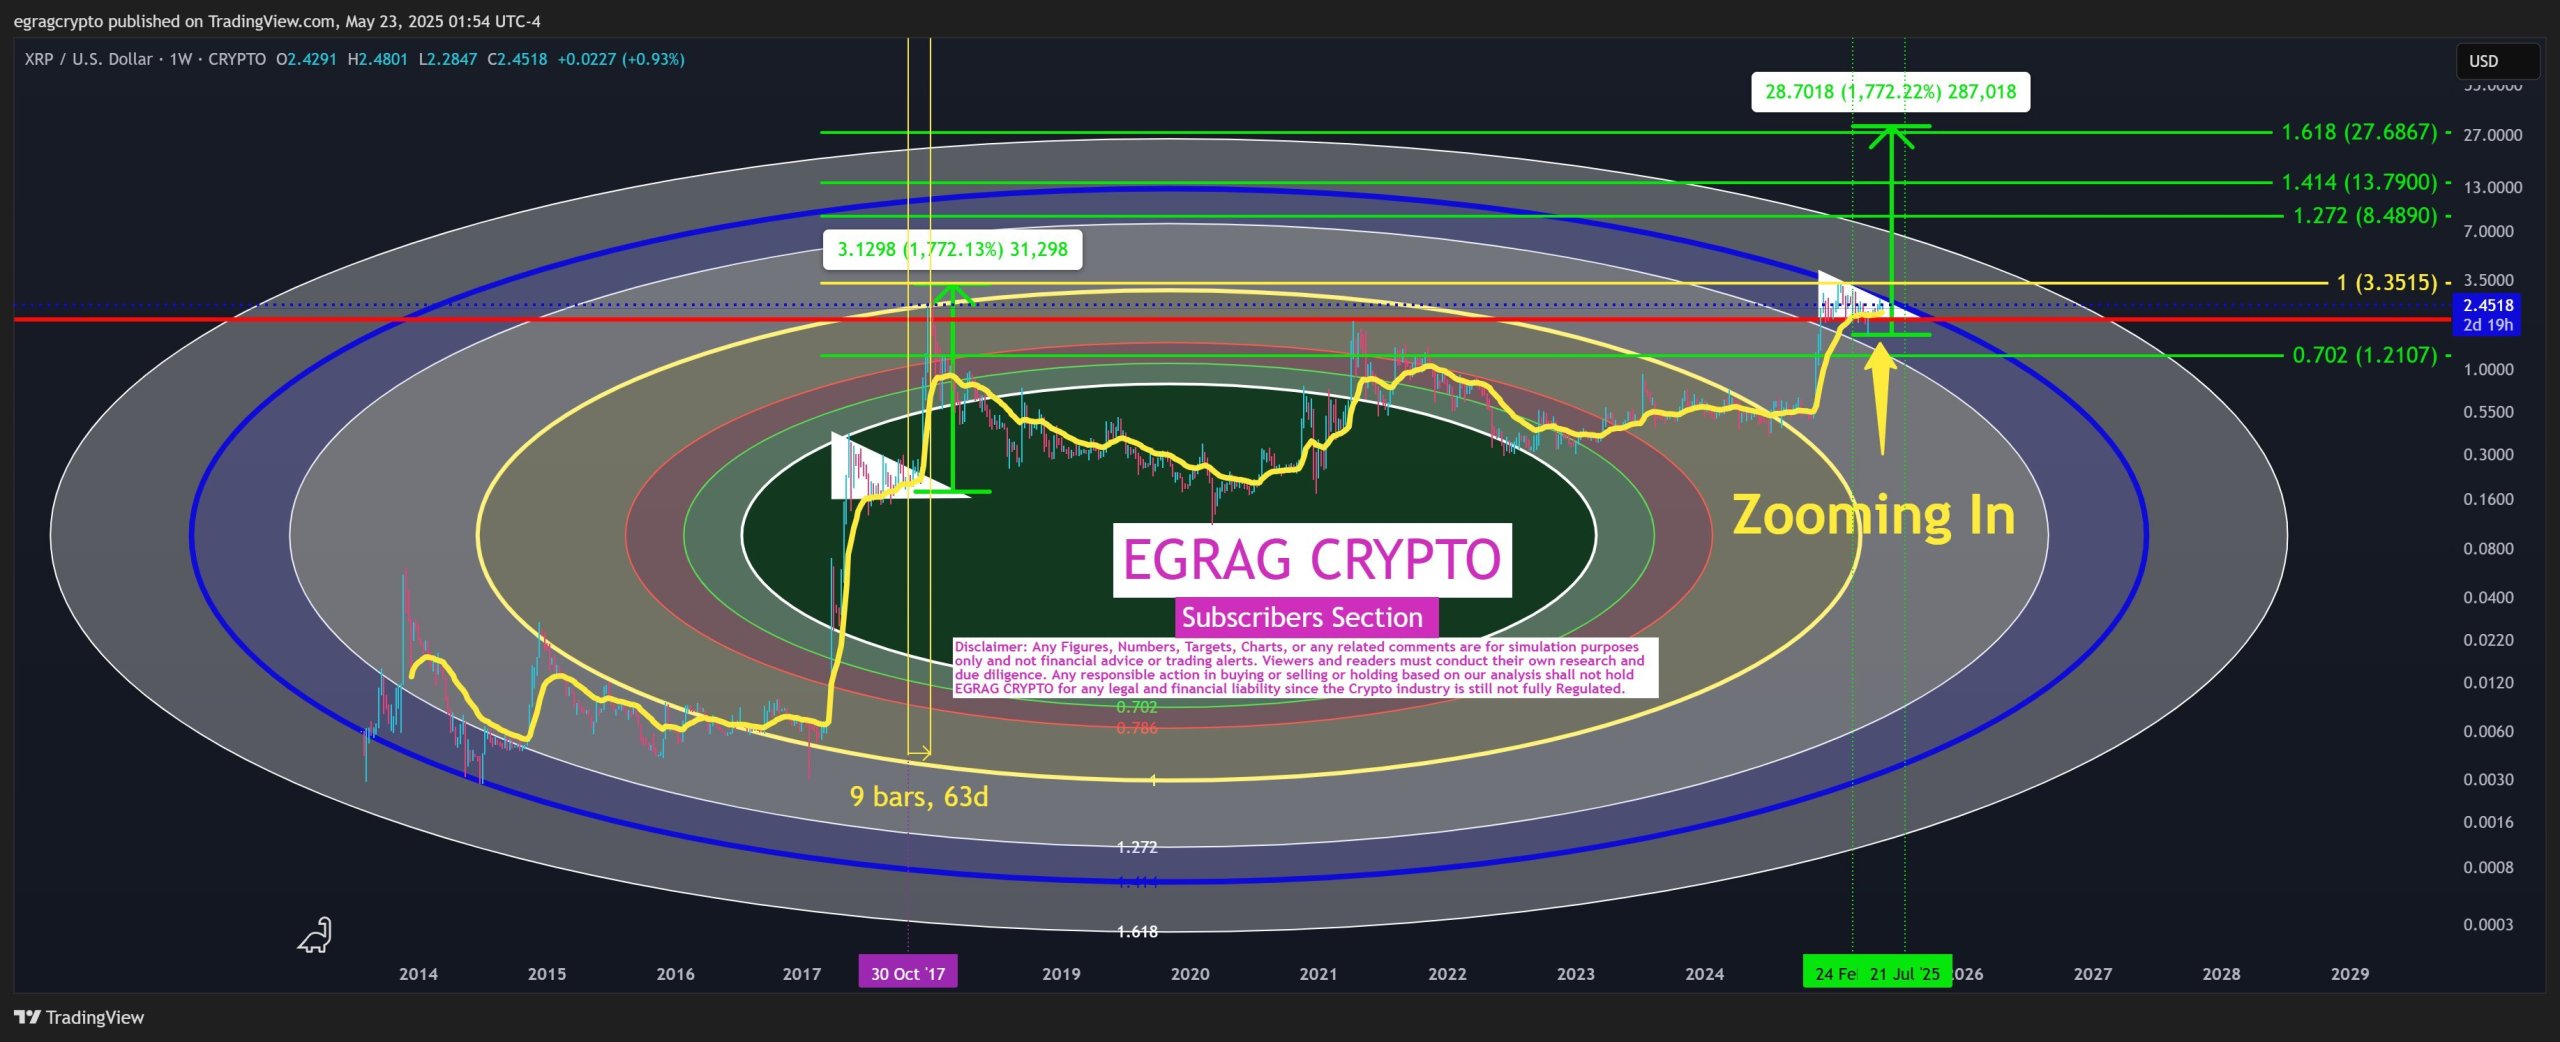
What’s striking in the setup is the visual symmetry between the 2017 breakout and the current market structure. According to EGRAG, XRP previously experienced a 1,772% surge over a 63-day period beginning in late October 2017. That historical movement is now mirrored in the current formation, which EGRAG describes as another ascending triangle pattern — typically a bullish indicator.
Surrounding the price chart are a series of Fibonacci arc levels, which are used to identify zones of support, resistance, and long-term trend strength. These arcs help contextualize XRP’s historical and potential future movements. Overlaying these arcs are Fibonacci extension levels, labeled in green, which suggest several possible target zones: $1.21, $3.35, $8.49, $13.79, and ultimately $27.68.
One of the most critical levels highlighted is $3.35 — the region of XRP’s previous all-time high. The chart implies that breaking and closing above this threshold could trigger the next phase of bullish momentum, possibly propelling XRP toward the $27-28 region.

EGRAG draws attention to a projected move that would reflect a similar 1,772% increase, just like in 2017. The forecasted path shows this move culminating around the $28 mark, under the condition that the breakout follows a similar time structure and pattern.
The analys expects the altcoin to take another 60 days for the 1,772% jump this time, which would push its price to the ultimate $27 target, currently aligning with the Fibonacci 1.618 extension.
Though the chart discreetly marks July 21, 2025, as a possible timeframe, the headline message is less about exact dates and more about the pattern’s potential.
At the center of the analysis is the notion that XRP may be coiling within a bullish structure — a setup that has historically led to parabolic gains once key resistance is broken. The phrase “Zooming In” on the chart suggests EGRAG’s belief that XRP is nearing a critical breakout phase.
It’s worth noting that the chart carries a disclaimer emphasizing that all targets and figures are for simulation purposes only, not financial advice. As always, investors are encouraged to conduct their own research and consider risk factors before acting on any projections.
The post Here’s When XRP Could Skyrocket Toward $28, According to Analyst appeared first on Coindoo.


.jpg.webp?itok=1zl_MpKg)


 Bengali (Bangladesh) ·
  English (United States) ·