
 3 weeks ago
13
3 weeks ago
13 

Technical indicators on multiple timeframes are leaning toward a continuation of the bearish trend, with market confidence deteriorating. FLOKI now faces a critical juncture as its market cap and support levels weaken in tandem.
Momentum Reversal Signals Caution Across Timeframes
The 1-hour chart for FLOKI/USDT on Open Interest reflected a clear shift in sentiment. After a prolonged downtrend into June 6, buyers stepped in aggressively, triggering a sharp upward movement marked by higher highs and higher lows.
This change suggested strong short covering or renewed spot buying. However, momentum began to deteriorate by June 11, with the price reversing sharply from a local peak just above 0.00001000. The subsequent selloff erased prior gains and took FLOKI below 0.00000800, indicating a breakdown in structure and potential liquidation-driven decline.
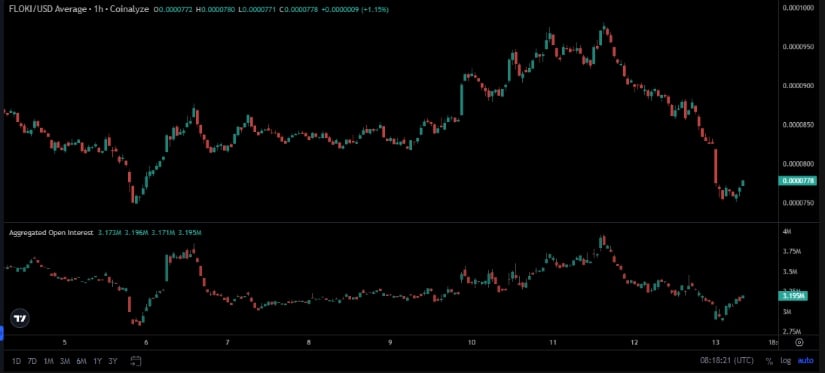
Source: Open Interest
Open Interest (OI) followed this behavior closely, initially rising with the price action and peaking around the same time. As the price began to fall, OI also dropped, suggesting an exit from positions, likely by long holders. The reduction in OI during the downturn highlighted a shift from participation to capital protection. Toward the end of the chart, a minor rebound in both price and OI was observed, which may indicate the formation of short-term support near the 0.00000760 range.
Floki Price Prediction: Daily Performance and Market Metrics Highlight Pressure
Additionally, in the past 24 hours, FLOKI’s price prediction dropped by 12.21% to $0.00007772, confirming a sharp bearish reversal. Early in the trading day, attempts were made to reclaim the $0.00008000 level, but persistent lower highs undermined confidence.
This pattern of lower highs and lower lows suggests continued control by sellers throughout the session. As buyers retreated, the market appeared to enter a phase of distribution rather than accumulation.
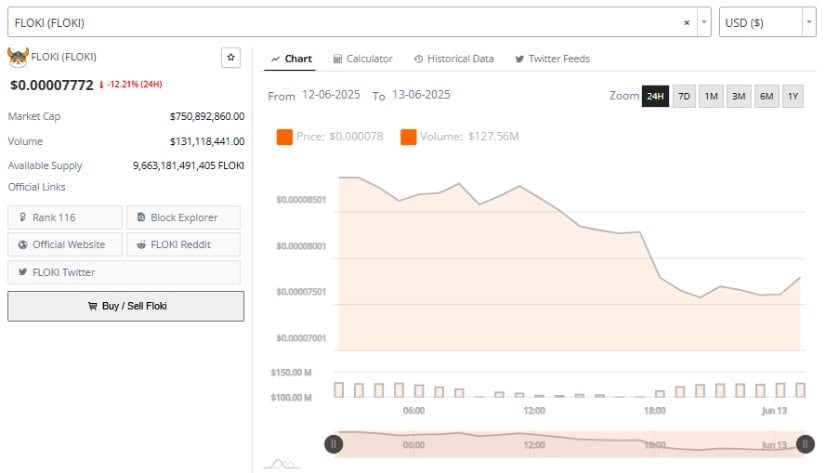
Source: Brave New Coin
The 24-hour volume stood at $127.56 million, just below the daily peak of $131.1 million. Although activity remained elevated, the decreasing trend in volume hinted at a waning appetite for risk, with much of the activity likely attributed to defensive trading rather than new entries.
FLOKI’s market cap declined to $750.89 million during this period, placing it at rank 116 and reflecting increased supply-side pressure. With an available supply of 9.66 trillion tokens, the project’s valuation remains vulnerable to large-scale exits unless countered by consistent demand.
Indicators on the Daily Chart Suggest Further Weakness
On the other hand, FLOKI’s daily price prediction chart on TradingView supports the view that downward momentum is strengthening. The price closed at $0.00007745, down 6.19%, with the Bollinger Bands tightening.
The price hovered near the lower band at $0.00007318, signaling that downward volatility could increase if support fails. A continued failure to regain footing above the middle band, currently at $0.00008850, suggests that sellers are maintaining control of the market narrative.
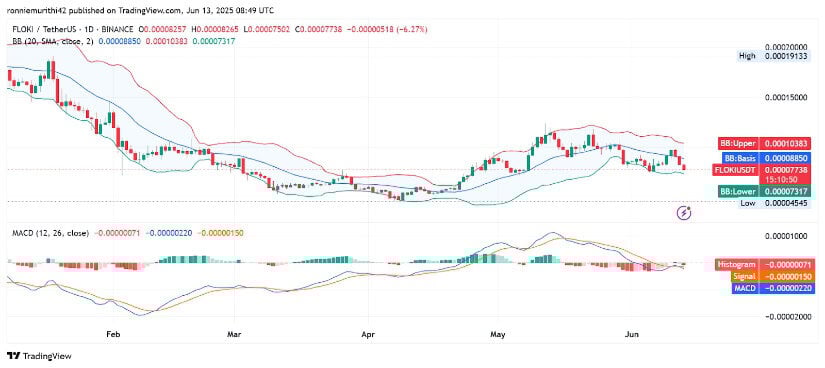
Source: Tradingview
MACD indicators have confirmed this trend, with the MACD line crossing below the signal line. Both lines are trending downward, and the histogram shows red bars, confirming a bearish setup. Previous rallies that began near the lower Bollinger Band have not yet materialized this time, indicating a change in short-term dynamics.
Should the price close decisively below the lower band, support could be tested in the $0.00006500–$0.00007000 range, a historically active zone for buying interest. A reversal would require significant price movement above the mid-band and a bullish MACD crossover — neither of which has materialized yet.
Meta Description: Floki price drops 12% with $130M in volume; bearish signals grow as market cap declines to $750 million.


.jpg.webp?itok=1zl_MpKg)


 Bengali (Bangladesh) ·
  English (United States) ·