
 3 weeks ago
32
3 weeks ago
32 
TLDR
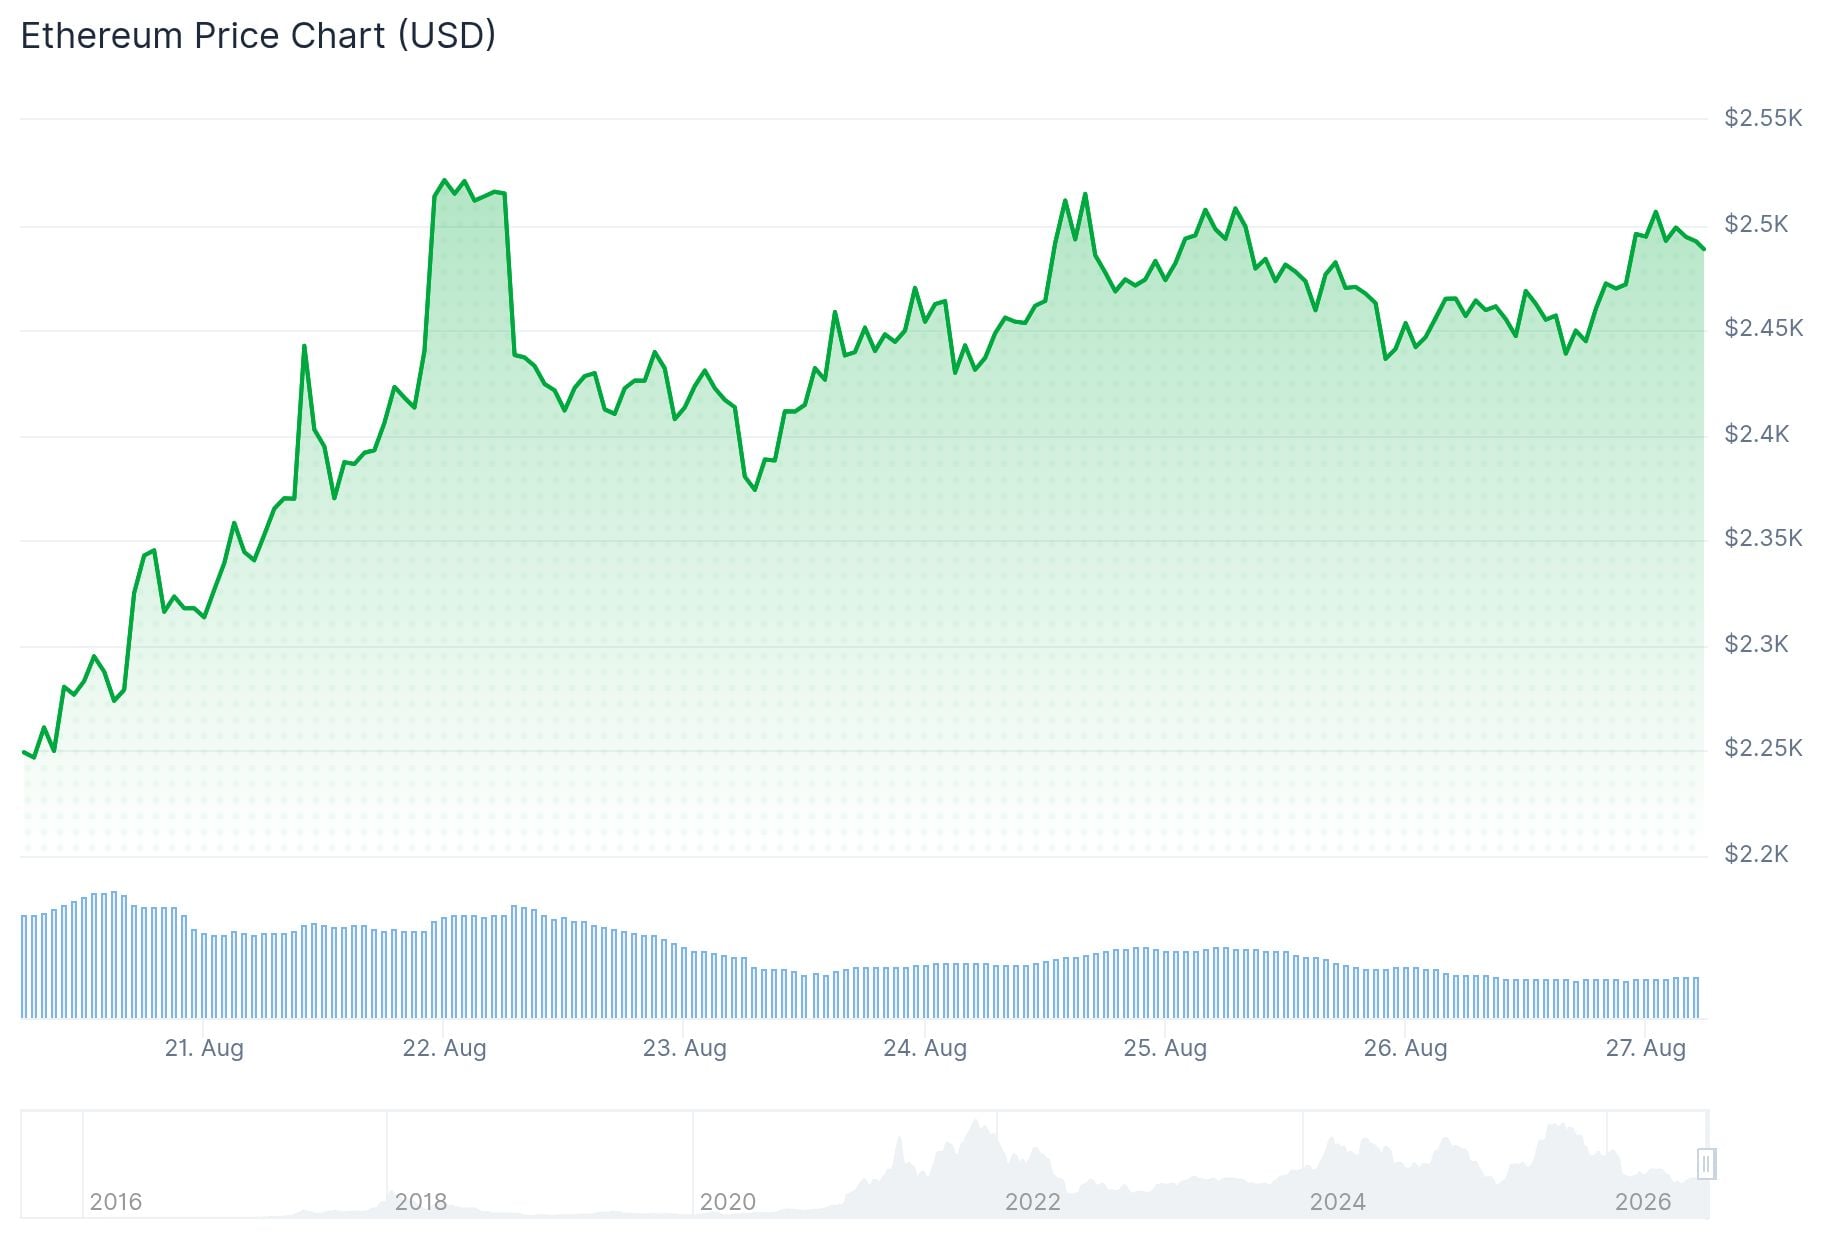
ETH is trading around $2,450–$2,460 after a 34% recovery from recent lows near $1,900 A bull flag pattern on the 4-hour chart puts resistance at $2,500–$2,550 Daily RSI is at 75.59, showing overbought momentum Whale sell walls are stacked at $2,550 and $2,600; a buy wall sits near $2,400 A weekly close above $2,400–$2,450 could open the path toward $2,823 and beyondEthereum is trading near $2,450 after a sharp recovery from lows around $1,900. The price reached a weekly high of $2,545.88 on Aug. 21 before pulling back into a tight range between $2,400 and $2,500.
 Ethereum (ETH) Price
The move from $1,900 to the weekly peak represented a gain of nearly 34%. ETH had spent much of August moving sideways below $1,950 before breaking through $2,000 and climbing toward $2,500.
Crypto analyst Donald Dean noted that Ethereum has broken above a descending trendline from its previous decline. Former resistance in the $2,400–$2,450 zone is now beginning to act as support, which analysts say is a constructive sign.
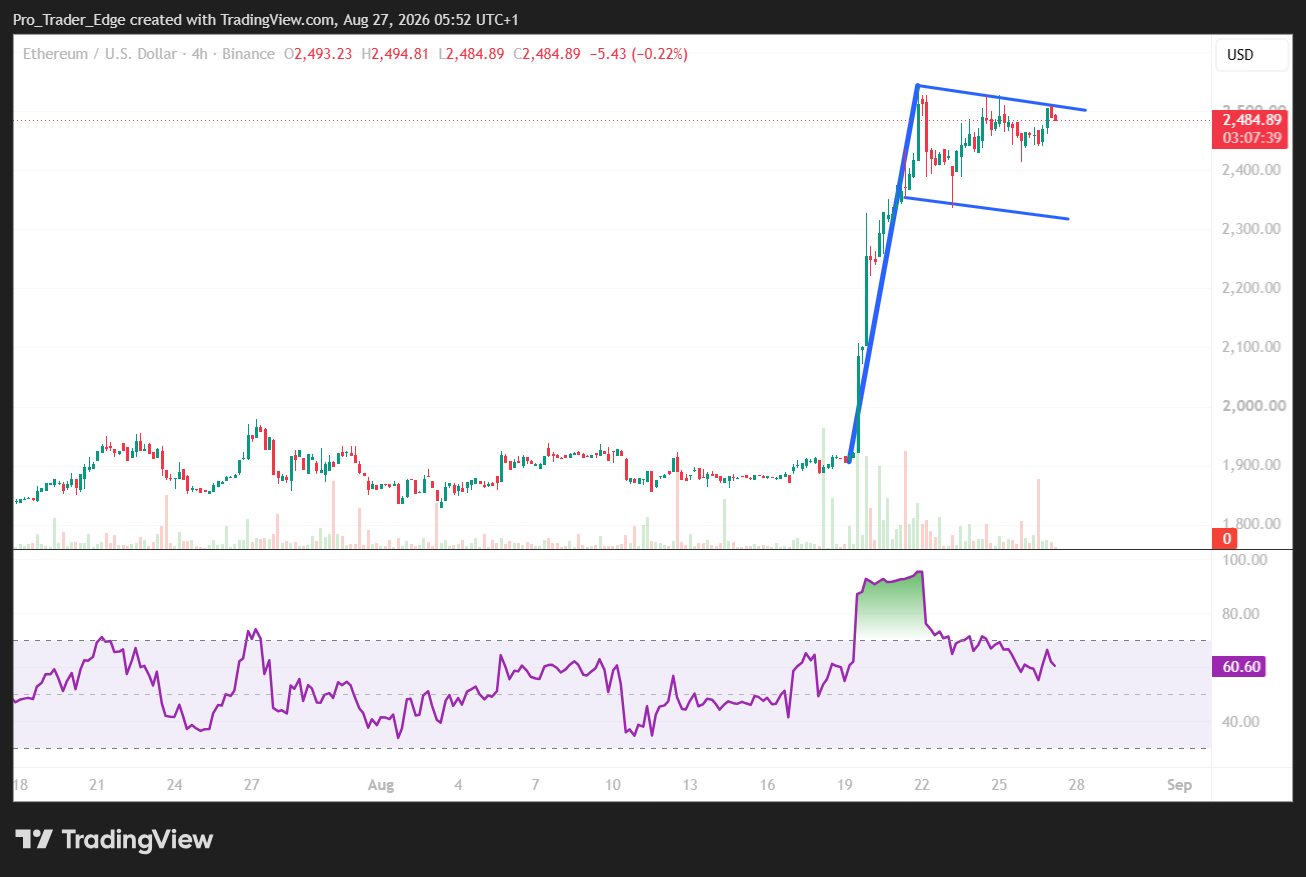
On the 4-hour chart, Ethereum is forming a bull flag — a downward-sloping consolidation channel following a steep advance. A close above $2,510–$2,530 would confirm the pattern and bring the $2,546 weekly high back into focus.
 Source: TradingView
Analyst Ted Pillows said on Aug. 26 that ETH needs a weekly close above $2,550 to open a possible move toward $3,000. He identified $2,550 as the main barrier for the next leg higher.
Resistance and Supply Levels
On-chain order data shows whale sell walls positioned at $2,550 and $2,600, creating a clear supply cluster just above current price. A large buy wall remains near $2,400, reinforcing technical support at that level.
CoinGlass liquidation data also shows the heaviest short liquidation cluster around $2,530–$2,560. A push into that zone could force short positions to close, potentially adding buying pressure.
Analyst Michaël van de Poppe said on Aug. 26 that an attractive area to buy an ETH dip may be approaching, pointing to a demand region broadly matching the $2,300–$2,400 support zone.
Trader Daan Crypto Trades posted on X that ETH is consolidating above previous resistance but warned that bulls need to push price to new local highs soon. He said a failure to do so could result in a deviation back below resistance — what he called a potential “liquidity grab.”
$ETH Consolidating on top of the previous resistance. But if you're a bull I would want to see this moving further up soon.
Otherwise you risk deviating back below the resistance and for this to turn into a big liquidity grab.
So ideally the bulls push this to new local highs… https://t.co/aj6makJdkP pic.twitter.com/6nlDu1OhPD
— Daan Crypto Trades (@DaanCrypto) August 26, 2026
Weekly Structure and Higher Targets
The weekly chart shows Ethereum reclaiming the $2,300–$2,400 region after recovering from lows near $1,500–$1,600. Analysts at Rand Group describe this as an important higher-timeframe development.
A weekly close above $2,400 keeps $2,800 and $3,400 in view. The next defined technical target above current price is $2,823, based on higher-timeframe structure analysis.
Analyst Crypto Tony’s chart highlights a possible retest of $2,420 before another push toward $2,630–$2,650. Holding $2,420 would keep the structure intact for that next move.
Ethereum is looking strong. My plan. No entry yet. pic.twitter.com/MoE9aB1V42
— Crypto Tony (@CryptoTony__) August 25, 2026
The daily RSI stands at 75.59, above the overbought threshold of 70. The Supertrend indicator places broader support at $2,158, around 14% below current price.
The post Ethereum (ETH) Price: ETH Is One Weekly Close Away From a Run to $3,000 – Watch These Levels appeared first on CoinCentral.





 Bengali (Bangladesh) ·
  English (United States) ·