
 2 months ago
32
2 months ago
32 
TLDR
Spot Ether (ETH) ETFs experienced their fifth consecutive day of outflows, losing $952 million over the period The outflows contrast with Bitcoin ETFs which saw $246.4 million in net inflows during the same week Ether price rose more than 16% in the past month, driven partly by the GENIUS Act passage Technical analysis shows ETH struggling below $4,400 with key resistance at $4,360 and support at $4,220 Market concerns about potential recession and weak US jobs data are contributing to risk asset selloffsSpot Ethereum ETFs have experienced their fifth consecutive day of outflows this week. The total withdrawals reached $952 million across the five-day period.
📉 Ethereum $ETH ETFs saw 5 consecutive outflow days this week.
💸 Total net outflows = $952.2M pic.twitter.com/juo3O45na5
— Trader Edge (@Pro_Trader_Edge) September 6, 2025
Friday recorded the largest single-day decline with $446.71 million leaving ETH-linked funds. The four-day trading week alone saw $787 million in outflows.
This pattern contrasts sharply with Bitcoin ETF performance during the same timeframe. Spot Bitcoin ETFs recorded $246.4 million in net inflows over the past week.
The current outflows follow a record-setting August for Ethereum ETFs. These funds attracted $3.87 billion in net inflows during that month.
Bitcoin ETFs showed the opposite trend in August with $751 million in net outflows. This reversal in relative performance between the two cryptocurrencies is drawing market attention.
Ethereum Price Prediction
Ethereum price currently trades just below $4,300 after declining 1.8% over the past week. The cryptocurrency has formed a short-term declining channel with resistance at $4,310.
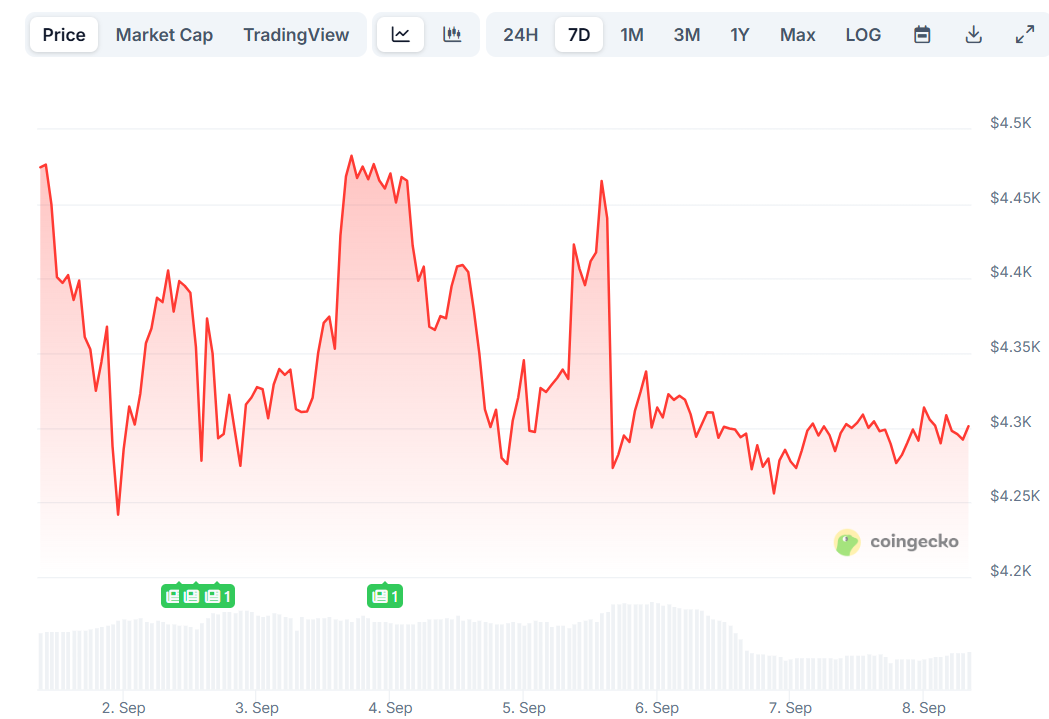 Ethereum (ETH) Price
Technical indicators suggest continued pressure on the downside. The hourly MACD is gaining momentum in the bearish zone while RSI has moved below the 50 level.
Key resistance levels sit at $4,360, representing the 50% Fibonacci retracement level from recent highs. A clear break above this level could push ETH toward $4,420 resistance.
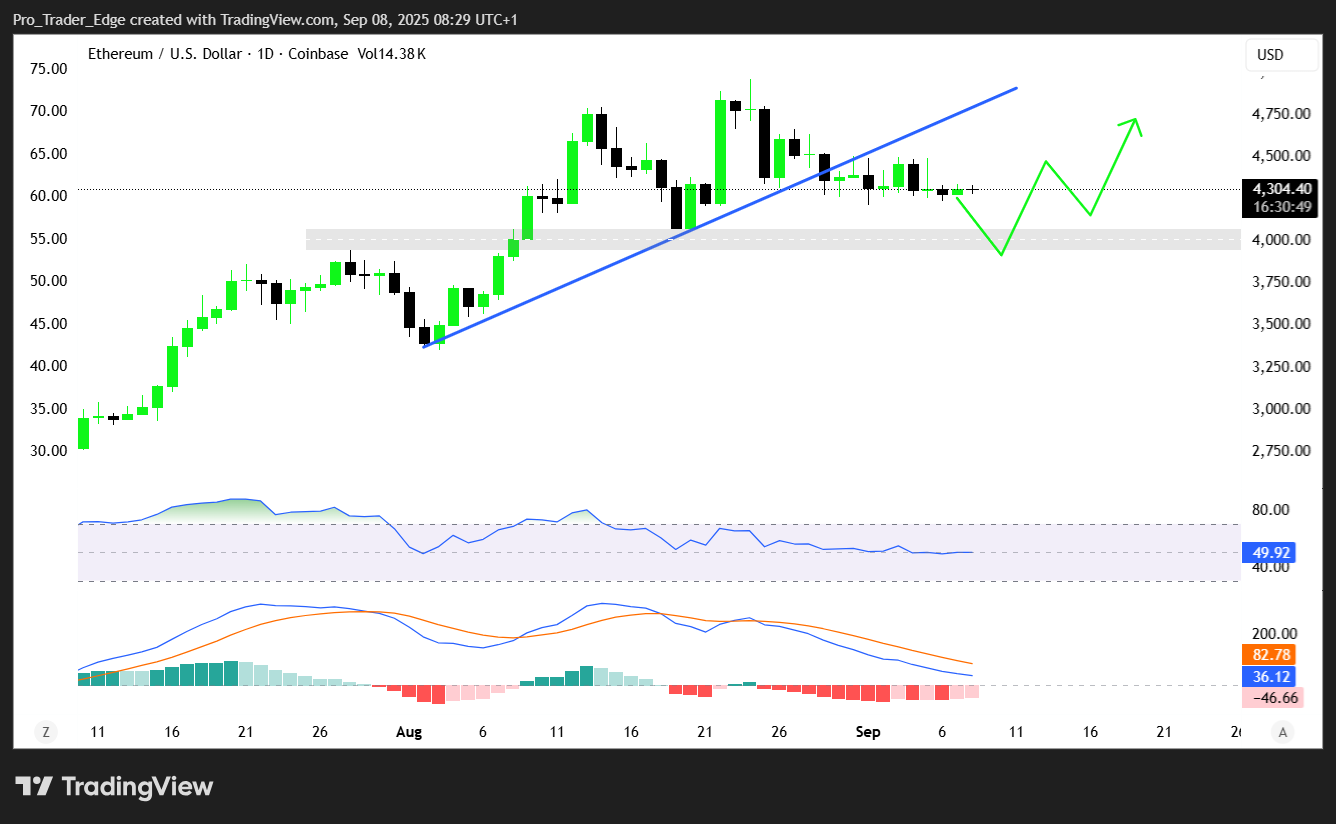 Source: TradingView
Support levels are established at $4,220 as the first major support zone. A break below this level could lead to further declines toward $4,200 and potentially $4,160.
The price attempted recovery above $4,450 but failed to sustain these levels. ETH remains below the 100-hourly Simple Moving Average, indicating continued bearish momentum.
Market Factors Behind the Movements
Despite recent ETF outflows, Ethereum has gained more than 16% over the past month. The GENIUS Act passage has provided regulatory clarity that benefits the cryptocurrency.
The legislation restricts stablecoin issuers from paying interest and offers clearer guidelines for institutional investment. This regulatory development has supported Ether’s monthly performance.
Current market concerns center on economic uncertainty and potential recession fears. Weak US jobs data has increased expectations for Federal Reserve interest rate cuts.
Traders are pricing in an 89% probability of a 25 basis point rate cut this month. An 11% chance exists for a larger 50 basis point reduction according to CME FedWatch data.
Polymarket shows similar expectations with 12% odds for a 50 basis point cut. These monetary policy expectations are influencing risk asset performance across markets.
Gold prices have reached $3,600 for the first time as investors seek safe haven assets. This flight to safety is contributing to outflows from riskier investments including cryptocurrency ETFs.
The recent low for Ethereum was established at $4,233 with current consolidation around these levels. Recovery attempts have faced resistance near the $4,320 area.
The Week Ahead: Tech Earnings and August Inflation Data Take Centre Stage
The post Ethereum (ETH) Price: ETFs Record Fifth Straight Day of Outflows Totaling $952 Million. What’s Next? appeared first on CoinCentral.


 Bengali (Bangladesh) ·
  English (United States) ·