
 2 months ago
19
2 months ago
19 
Ethereum (ETH) is showing conflicting signals as it navigates a pivotal zone. Analysts are closely watching technical and on-chain indicators to determine whether the asset is due for a short-term correction or preparing for a full-fledged rally reminiscent of the 2020–2021 cycle.
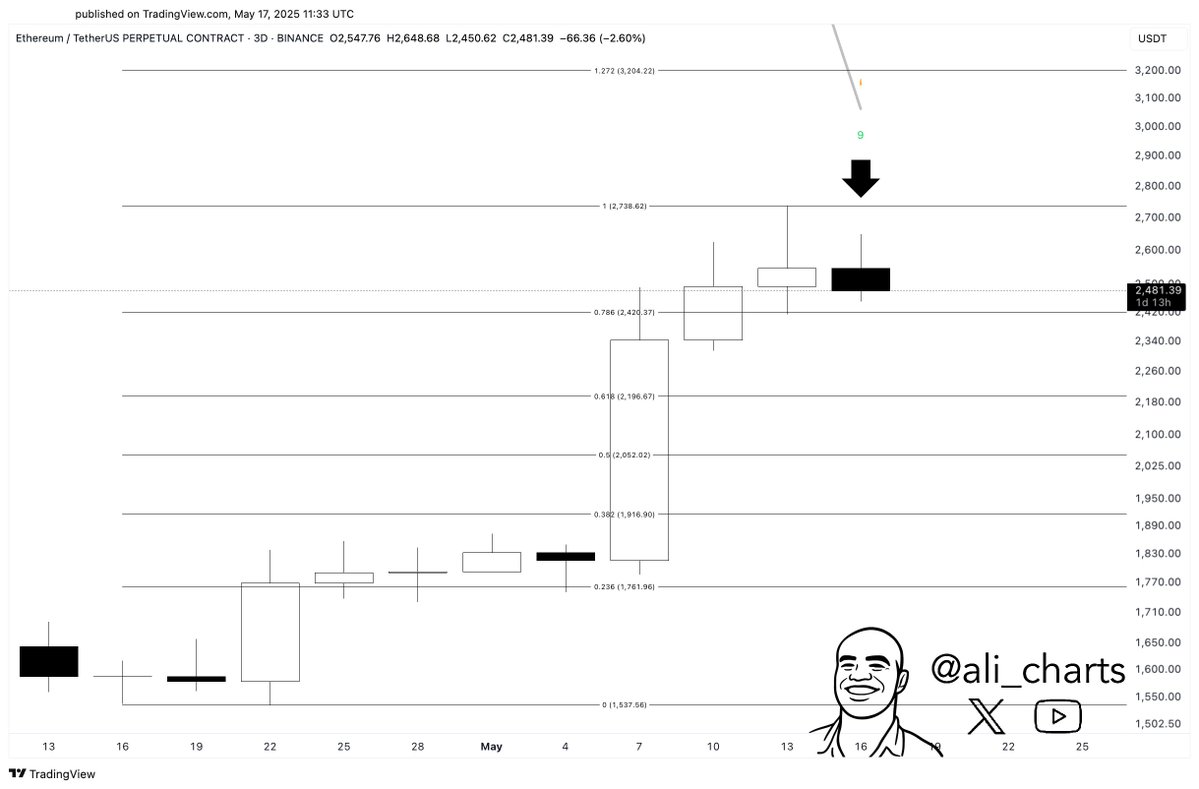
Short-Term Sell Signal: TD Sequential Indicator Flashes Warning
According to market analyst Ali Martinez, Ethereum could be headed for a brief pullback. The TD Sequential indicator has flashed a sell signal on the 3-day chart, following a strong move upward toward the $2,600 range.
“ETH could be bound for a brief correction,” Ali noted, suggesting the momentum may be fading after a strong rally.
This indicator has historically been a reliable signal for short-term trend reversals — particularly when markets are overheated.
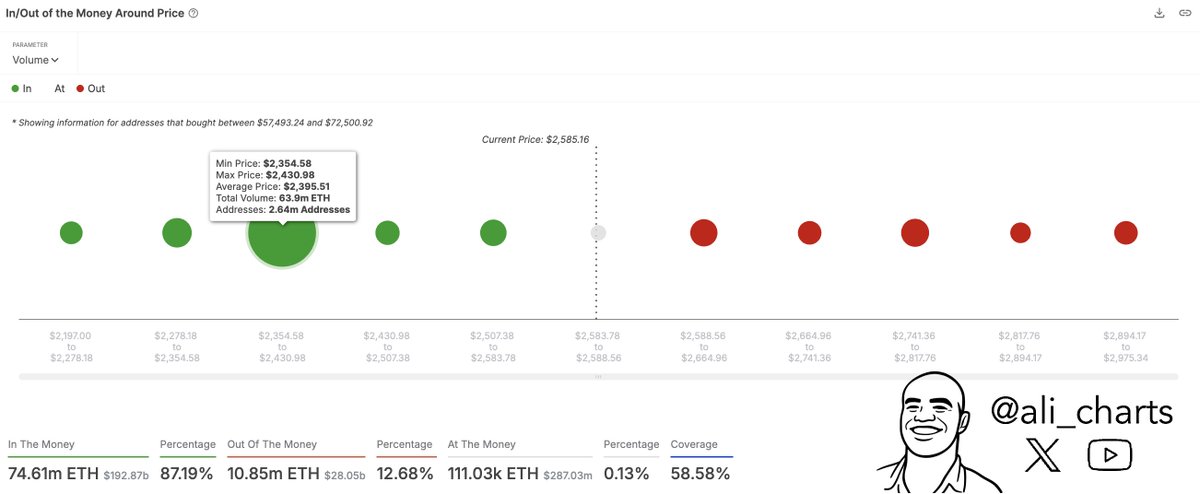
Key Support at $2,400: On-Chain Data Suggests Strong Demand Zone
On-chain insights from SentoraHQ, shared by Ali, show a heavy concentration of wallet activity between $2,354 and $2,431, making $2,400 a critical support level.
This zone includes 6.3 million ETH held by 2.64 million addresses. Ethereum is currently trading slightly above this cluster, around $2,480.If ETH fails to hold this level, it could quickly fall to lower Fibonacci levels. But if the support holds, it may act as a springboard for another leg higher.
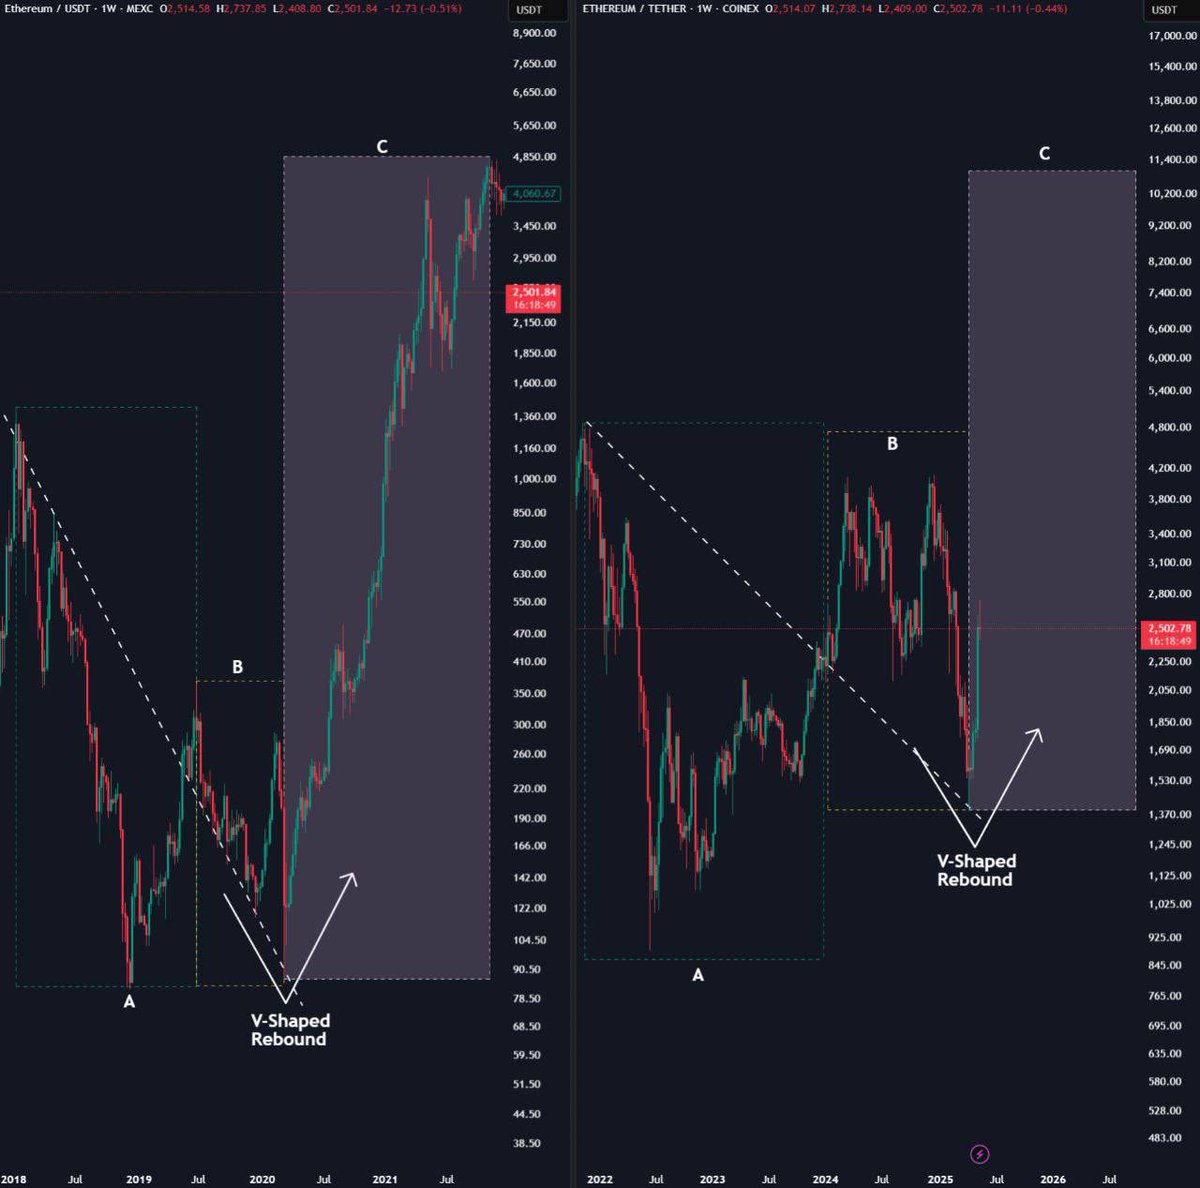
📈 Bullish Macro Structure: V-Shaped Recovery In Progress?
Adding a longer-term perspective, crypto analyst Ash believes Ethereum is undergoing a V-shaped rebound, mirroring the structure seen during the 2020–2021 cycle.
His comparison of the current weekly ETH chart to the historical rebound pattern suggests Ethereum may already be mid-recovery, and if the pattern plays out similarly, new highs could be on the horizon.
“Study the 2020–2021 cycle and you’ll know what happens next,” Ash stated confidently.
Final Takeaway
Ethereum’s current position is precarious but promising. Traders should watch:
$2,400 as a key support line. Whether the TD Sequential sell signal triggers follow-through selling. If the macro structure aligns with past bullish recovery phases.
Short-term volatility may shake out over-leveraged positions, but the long-term chart still looks structurally bullish. The next few days will be crucial in determining whether ETH dips before ripping — or continues marching upward without pause.
The post Ethereum at a Crossroads: V-Shaped Recovery or Short-Term Pullback? appeared first on Coindoo.


.jpg.webp?itok=1zl_MpKg)


 Bengali (Bangladesh) ·
  English (United States) ·