
 3 weeks ago
40
3 weeks ago
40 
Introduction
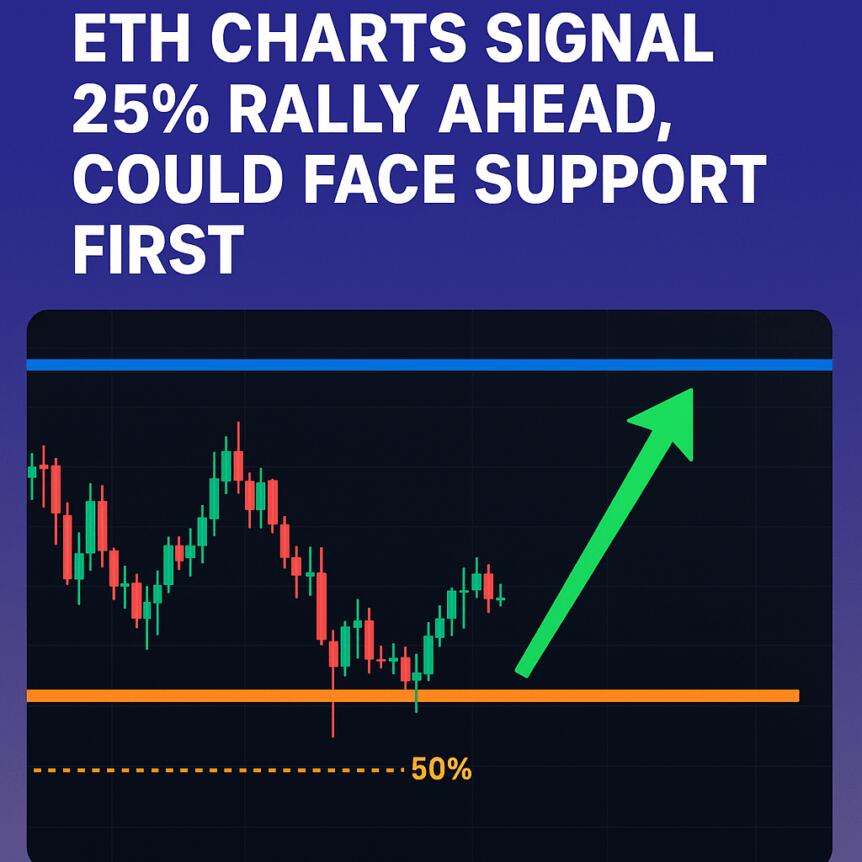
Ethereum is currently trading near $3,300, with technical indicators suggesting a potential short-term decline before resuming a bullish trend. Market dynamics and leverage metrics point to an impending liquidity sweep, which could set the stage for a significant upside move in the coming weeks.
Key Takeaways
Ethereum’s Leverage Ratio approaches levels historically preceding 10% to 25% rallies. The ETH SOPR remains below 1, indicating overall realized losses despite recent gains. Repeated leverage patterns have historically led to short-lived dips followed by strong upward reactions. Current market sentiment shows persistent risk appetite, even amidst overleveraged conditions.Market Indicators and Leverage Dynamics
Crypto analyst Pelin Ay highlighted a recurring structure in Ethereum’s leverage environment. When the leverage ratio rapidly escalates on Binance, it often triggers short-term downside wicks as overleveraged long positions are liquidated, followed by robust rebounds. Notably, this pattern has been observed multiple times throughout early 2025, including in February, April, September, and November, and once again in October. During this period, a sharp leverage spike precipitated a quick sell-off before trend continuation.
ETH’s estimated leverage ratio on Binance. Source: CryptoQuantCurrently, the leverage ratio hovers near 0.60, a relatively elevated level indicating persistent risk appetite. Despite recent price increases, leverage levels have not declined, suggesting traders remain aggressively positioned. Historically, similar leverage conditions have preceded rallies of 10% to 25%, implying that Ethereum may be primed for an upward move following a final liquidity sweep.
Meanwhile, data from Glassnode shows divergence in holder behavior. Despite outperforming Bitcoin from January lows, Ethereum’s spent output profit ratio remains below 1.0, indicating that on aggregate, losses surpass profits. This suggests lower conviction among spot holders compared to Bitcoin’s market participants.
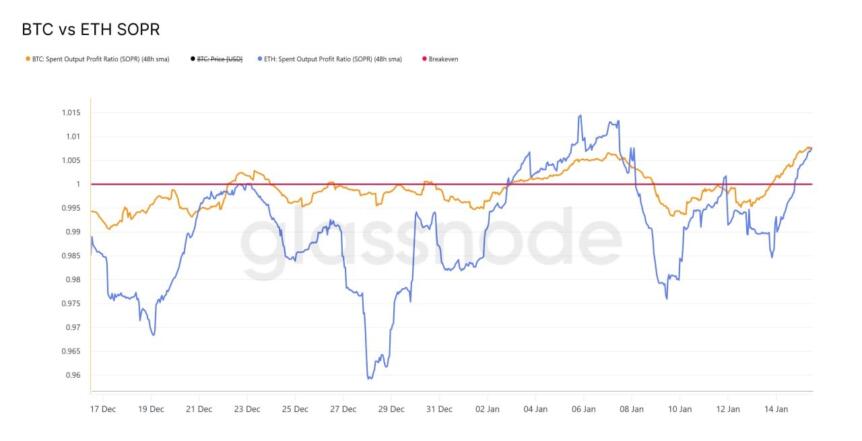 BTC vs ETH SOPR comparison. Source: Glassnode/Sean Rose
Overdue Dip and Potential Upside
Ethereum recently closed the day at $3,324, its highest daily close since November 12, 2025. A 25% rally from here could push prices above $4,100, but analysts suggest a short-term dip remains likely. Technical analysis reveals an order block zone between $3,050 and $3,170 — a level marked by high trading volume activity since September 2025, as indicated by the Visible Range Volume Profile. This area might act as a magnet for price retracement, aligning with a fair value point where buyers and sellers previously balanced.
Supporting this notion, data from Hyblock Capital indicates concentrated net long positions exceeding $500 million within the $3,040 to $3,100 range, increasing the probability of a brief sweep into this zone before a potential bullish continuation. Such a move could set the foundation for a stronger rally if buying interest resurfaces in this critical support area.
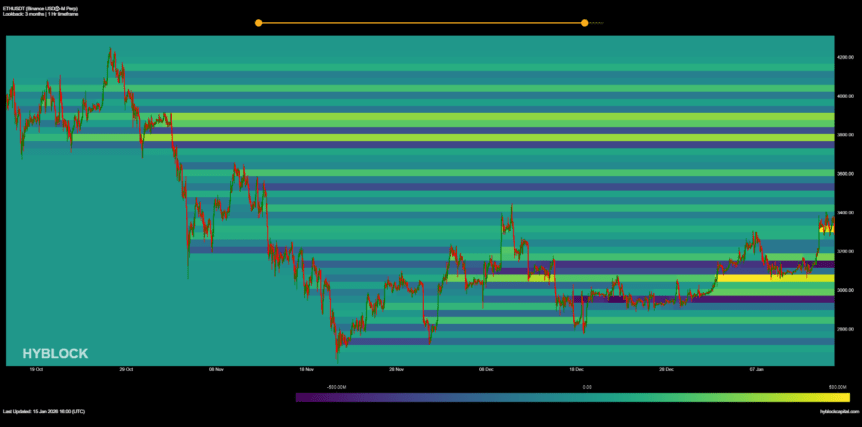 Net long positions for Ethereum. Source: Hyblock Capital
Conclusion
Ethereum’s technical setup suggests a potential short-term dip is on the horizon, driven by overleveraged trading conditions. However, the overall market sentiment and historical patterns point to a possible vigorous rebound, positioning ETH for a significant rally once this liquidity flush completes. Traders should watch key support zones and leverage metrics for further clues on the next directional move.
This article was originally published as ETH Charts Signal 25% Rally Ahead, Could Face Support First on Crypto Breaking News – your trusted source for crypto news, Bitcoin news, and blockchain updates.


 Bengali (Bangladesh) ·
  English (United States) ·