

The Dogecoin price is closing in on a critical technical trendline that could ignite its next major rally. After months of downward pressure, analysts are eyeing a possible breakout toward the long-awaited $1 target.
$1 Dogecoin Price Target Closer Than Ever
Crypto analyst Master Kenobi believes that the Dogecoin price could reach the highly coveted $1 target before the end of this market cycle. Based on his technical analysis, DOGE is once again mirroring a historical breakout pattern that previously led to an explosive surge in price.
The analyst shared a Dogecoin price chart with two main sections highlighted. The first green box, between September to November 2024, shows a historical breakout that occurred after the meme coin broke above a critical descending trendline. Following this breakout, the price surged significantly over the next 55 days.

Notably, the descending trendline has acted as a strong resistance for months. However, with Dogecoin’s momentum currently building, Master Kenobi believes that a strong breakout is imminent.
Looking at DGOE’s price action, it appears the same conditions for its previous breakout are forming again. Master Kenobi’s technical analysis suggests that a breakout above the current descending resistance line could spark a similar rally, one that could potentially take Dogecoin from its current price of $0.158 to $0.9 or even $1. Such a move would represent a staggering gain of approximately 533%.
Similar to past trends, Dogecoin’s current chart indicates a projected 55-day move following the breakout, with the green arrow and shaded box indicating a path to the conservative $0.9 target. This would place Dogecoin’s target window during the first few weeks of June, aligning closely with historical timelines from the last major breakout.
Adding to the optimism, Dogecoin’s Relative Strength Index (RSI) currently sits around 43.35 — a level typically considered a neutral to oversold zone. The current descending resistance line has already been tested multiple times, meaning a clean daily close above it could spark Dogecoin’s next major rally.
Dogecoin RSI Shifts From Bearish To Bullish
Dogecoin is showing promising signs of a bullish reversal after a key breakout of a technical pattern on the 4-hour chart. According to a recent chart analysis by crypto analyst Trader Tardigrade, Dogecoin has exited a Falling Wedge formation and is preparing for an uptrend continuation. The breakout was confirmed as the RSI crossed above the 50 level, signaling a shift from bearish to bullish sentiment among traders.
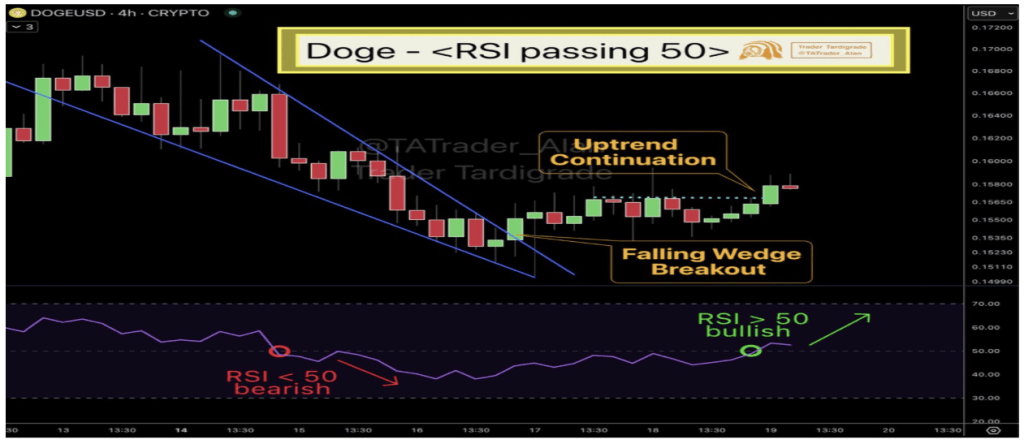
Before the Falling Wedge breakout, Dogecoin had been trading in a downward channel, characterized by lower highs and lower lows. This pattern often precedes an upward price movement, and Dogecoin seems to be following through with this trend. As a result, the analysis suggests that Dogecoin could push toward stronger resistance levels in the short term.
Featured image from Pexels, chart from TradingView


 Bengali (Bangladesh) ·
  English (United States) ·