
 2 weeks ago
9
2 weeks ago
9 
The chart, shared by Cryptoquant shows “Too Many Retail” periods in red bubbles, which cluster consistently around DOGE price tops. These periods are characterized by a significant influx of retail traders participating in short-term futures contracts. Historically, these spikes have been followed by sharp corrections or trend reversals.
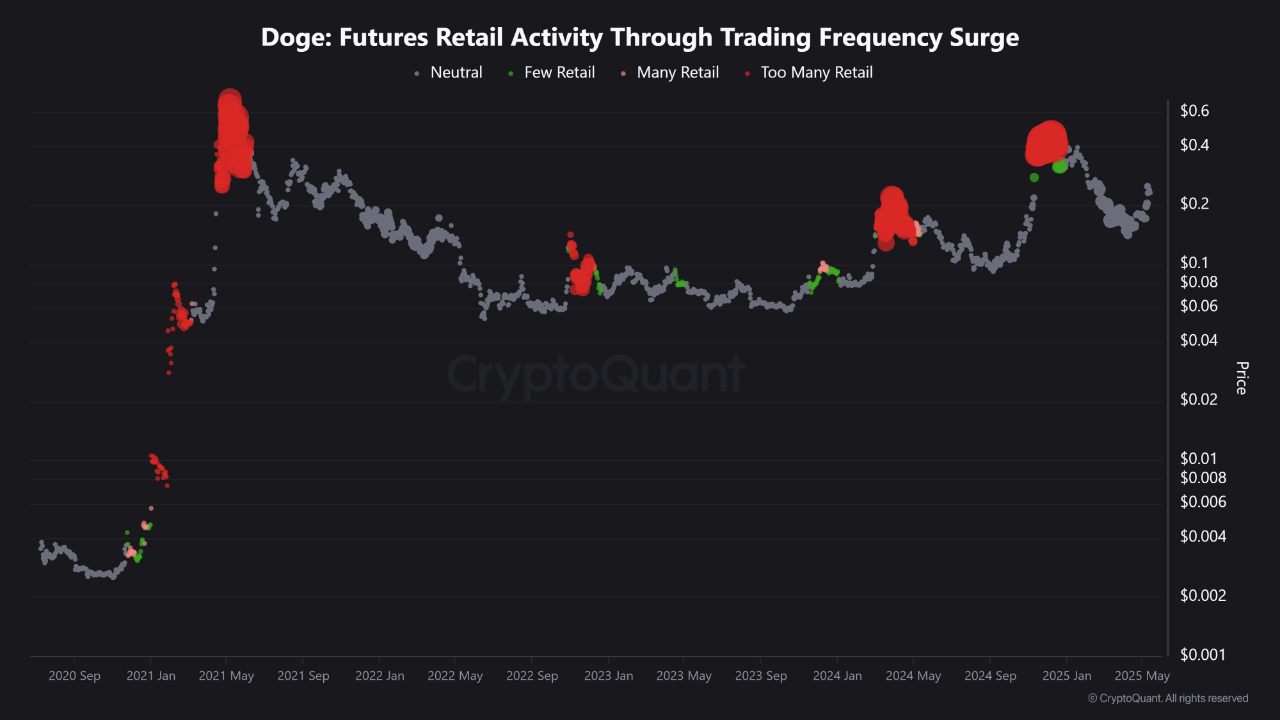
📍 Red bubble = Overheated retail activity, price top likely.
In contrast, green and pink bubbles—representing “Few Retail” and “Many Retail” periods—typically correlate with more balanced or healthier market conditions, and often appear during consolidation or early-stage rallies.
Why It Matters
This visual tool provides a sentiment-based indicator for traders seeking to time entries and exits. Particularly for volatile assets like Dogecoin, retail trading activity in futures markets can offer a strong proxy for momentum shifts.

For analysts and active market participants, tracking retail futures behavior may help identify:
Momentum exhaustion Short-term tops Potential reversalsAs the crypto market matures and derivatives trading continues to expand, behavioral indicators like these could become increasingly valuable for navigating high-volatility environments.
The post DOGE Futures Bubble Near Price Peaks, Data Shows appeared first on Coindoo.


 Bengali (Bangladesh) ·
  English (United States) ·