
 29 minutes ago
3


The People’s Bank of China (PBOC) increased its reported gold holdings to 78.30 million troy ounces at the end of October, up 830,000 ounces from September. The latest addition highlights Beijing’s continued reserve accumulation as global precious metals markets experience significant price volatility.
China’s Gold Reserves Reach 78.30 Million Ounces
According to official data published by China’s State Administration of Foreign Exchange (SAFE) on November 7, the country’s gold reserves increased from 77.47 million troy ounces in September to 78.30 million ounces in October. The monthly increase represents approximately 25.8 metric tonnes, extending the central bank’s consecutive purchasing streak to two years.
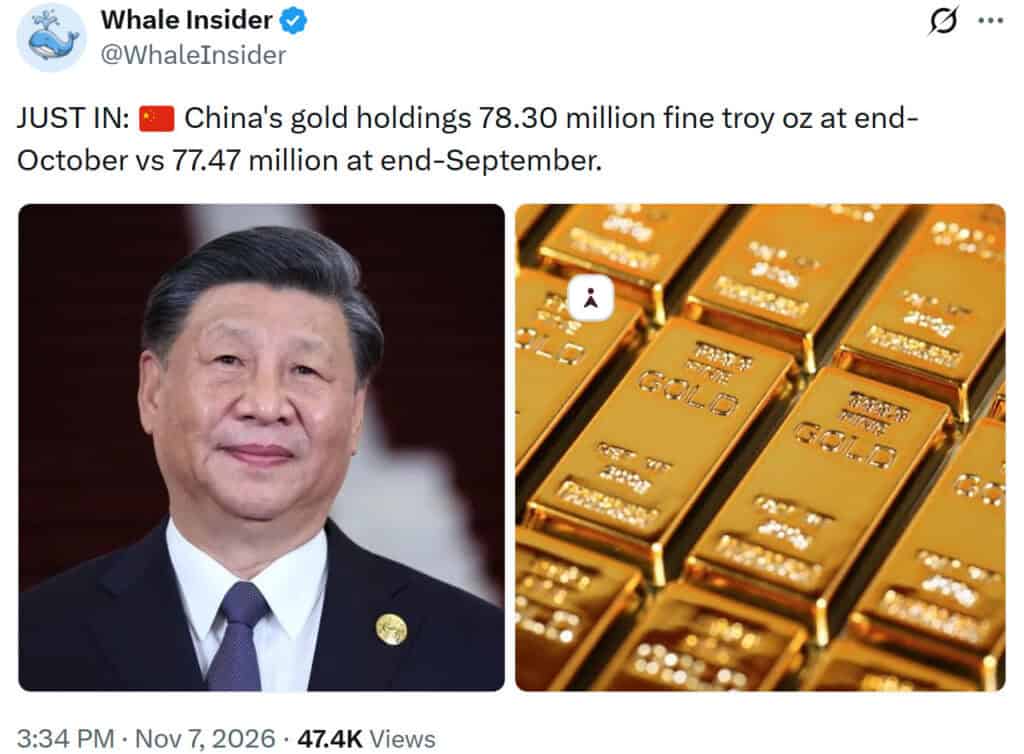
China raised its gold reserves by 26 tonnes in October 2026 to 78.30 million ounces, extending its central bank buying streak to 24 consecutive months. Source: Whale Insider via X
The latest addition also follows an increase of 23 tonnes in September, which the World Gold Council (WGC) identified as the PBOC’s largest monthly purchase since October 2023. China’s gold accumulation accelerated during the third quarter, bringing its reported additions for that period to 63 tonnes.
The increase in physical holdings contrasts with a decline in its reported dollar valuation. SAFE data shows China’s gold reserves were valued at about $306.41 billion at the end of October, down from $323.52 billion in September. The reduction reflects the impact of falling bullion prices rather than a decrease in the quantity of gold held.
This distinction is important when assessing central bank reserve movements. An increase in physical gold holdings can occur alongside a decline in their market value, particularly during periods of significant price corrections.
China Continues Gold Buying Despite October Price Decline
China’s latest purchase came during a difficult month for the precious metals market. Gold prices fell nearly 7% in October, ending the month below the $4,000-per-ounce threshold after reaching a one-year low.
Despite the downturn, the PBOC maintained its accumulation strategy. According to figures reported by Investing.com, China’s gold purchases during the first 10 months of 2026 reached approximately 129 tonnes.
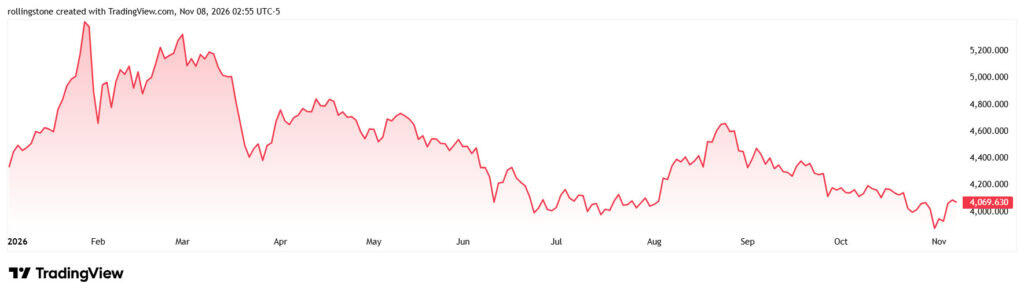
Gold (XAUUSD) price chart. Source: TradingView
The buying pattern also reflects broader interest among central banks in increasing their gold allocations. World Gold Council figures show that central banks collectively purchased a net 321 tonnes of gold between July and September, representing their strongest quarterly accumulation since the final three months of 2024.
China was the largest publicly disclosed official-sector buyer during the third quarter. Its continued purchases provide evidence of sustained institutional demand, even as fluctuations in gold prices create pressure across the broader market.
Gold also serves a different purpose from conventional interest-bearing reserve assets. The World Gold Council identifies its safety, liquidity, and return characteristics as important considerations for central banks holding the metal.
However, the latest reserve figures do not establish a specific motive behind Beijing’s purchases. Continued accumulation is consistent with efforts to diversify official reserves, although the precise balance between diversification, long-term asset allocation, and other considerations remains unclear.
Gold Price Technical Analysis: XAUUSD Signals Remain Mixed
While China’s gold accumulation continues, the international spot market faces a mixed technical outlook. TradingView data for the November 6 close shows XAUUSD at $4,069.630, down $17.520 or 0.43% during the session.
The overall technical summary remained neutral, with nine sell signals, nine neutral readings, and seven buy signals. This distribution indicates that bearish pressure has not fully displaced positive signals across the technical indicators.
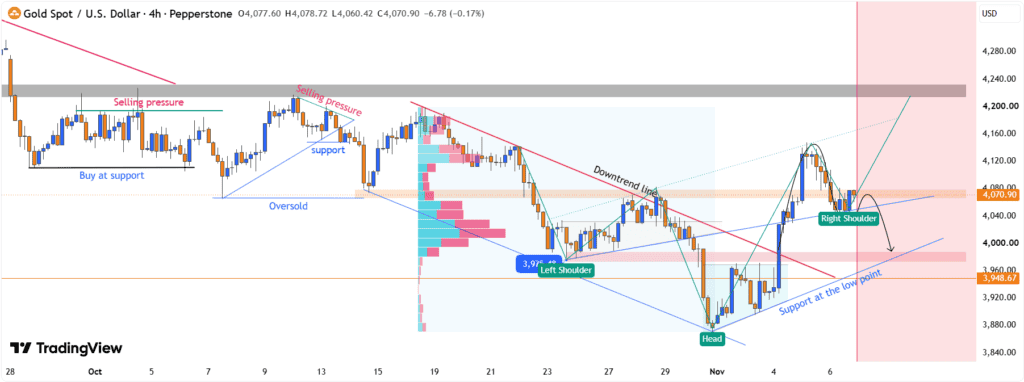
XAUUSD formed a potential inverse head-and-shoulders pattern after its late-October reversal, with the head near $3,875 and shoulders around $3,972–$3,988 and $4,030–$4,080, respectively. Source: Alina_XAU_Journal on TradingView
The Relative Strength Index (RSI) on the 14-period setting stood at 48.315, indicating neutral momentum. The Stochastic %K registered 65.384, while the Commodity Channel Index (CCI) remained close to zero at -0.454. Both indicators also pointed to neutral conditions.
Other momentum indicators delivered mixed readings. The 10-period Momentum indicator registered 75.303 with a buy signal, while the MACD level at -49.276 also generated a buy reading. However, the Bull Bear Power indicator showed 51.360 and registered a sell signal.
Moving averages presented a comparatively cautious picture. The 10-period exponential and simple moving averages stood at $4,034.255 and $4,013.373, respectively, with both indicating buy signals. The corresponding 20-period averages at $4,065.730 and $4,066.650 also remained supportive.
The picture changed across longer timeframes. The 30-period, 50-period, 100-period, and 200-period moving averages generated sell signals. The 200-period simple moving average stood at $4,480.106, considerably above the latest closing price.
Overall, the moving-average group recorded eight sell signals, one neutral reading, and five buy signals. This suggests that the recent price recovery has not yet produced a broad improvement in the longer-term technical structure.
Key Support and Resistance Levels for Gold
Pivot calculations provide additional reference points for XAUUSD traders. The classic central pivot stood at $3,991.098, placing the November 6 closing price above this level.
The first classic resistance level was $4,111.942, followed by $4,348.693 at R2. On the downside, the first classic support level was $3,754.347, with additional support at $3,633.503.
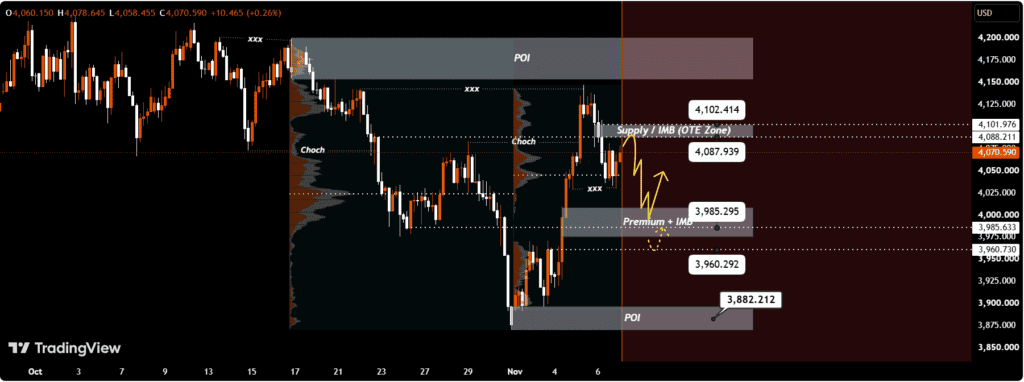
XAUUSD showed signs of a short-term bullish structural shift after rebounding from $3,882, with a Change of Character emerging around $4,070–$4,087. Source: TheNakedTraderFX on TradingView
Fibonacci calculations presented a slightly different resistance structure. The first Fibonacci resistance stood at $4,127.700, followed by $4,212.092. Its first support level was $3,854.497, providing another reference point if selling pressure returns.
The $3,991 region therefore represents an important central pivot reference, while the $4,111–$4,128 area marks the next resistance zone based on classic and Fibonacci calculations.
A sustained move above the resistance area could improve the short-term technical picture. Conversely, a decline toward the central pivot would bring the market back to a level that could help assess the strength of the November recovery.
These calculations represent technical reference levels rather than confirmed price targets. Broader market conditions and changes in buying and selling pressure will remain important.
Central Bank Demand and the Broader Gold Market Outlook
China’s continued gold purchases provide a contrasting signal to the recent price weakness. The PBOC has maintained its accumulation streak through several market conditions, including October’s sharp correction.
However, central bank demand is only one component of the global gold market. Interest-rate expectations, currency movements, geopolitical developments, and investment flows can influence bullion prices independently of official-sector purchases.
Gold does not generate interest payments, making its relative attractiveness sensitive to changes in bond yields and monetary policy. Expectations of higher interest rates can increase the opportunity cost of holding the metal, while lower borrowing costs can improve its appeal relative to interest-bearing assets.
For now, China’s latest reserve figures reinforce the presence of sustained official-sector demand. The increase of 25.8 tonnes during October demonstrates that the PBOC continued accumulating gold despite the market downturn.
The technical picture, meanwhile, remains mixed, with neutral oscillators and weaker longer-term moving averages. Whether gold can maintain its recovery will depend on broader market conditions and whether buying pressure can overcome the resistance levels identified by technical indicators.





 Bengali (Bangladesh) ·
 English (United States) ·