
 3 months ago
23
3 months ago
23 

This period of consolidation, marked by low volatility, has historically been a precursor to substantial upward moves in price. As the asset stabilizes at around $23.05, it continues to form a long-term symmetrical triangle pattern, suggesting a strong bullish move ahead.
Analyst Ali highlights the potential to surge towards $100 if it breaks out from this pattern. The key price targets, identified using Fibonacci levels, reinforce the strong upward momentum. With the token at a key support near $23.00, investors should watch for breakout signals or volume changes indicating the next price move.
Symmetrical Triangle Formation and Current Position
The chart analysis reveals that the token has been trading within a defined range, showing low volatility over an extended period. The formation of a symmetrical triangle suggests a compression of price action, where the market is preparing for a decisive move.
More so, the asset’s current price sits at $23.57, which is near the apex of the triangle, making it a critical juncture for potential price action.
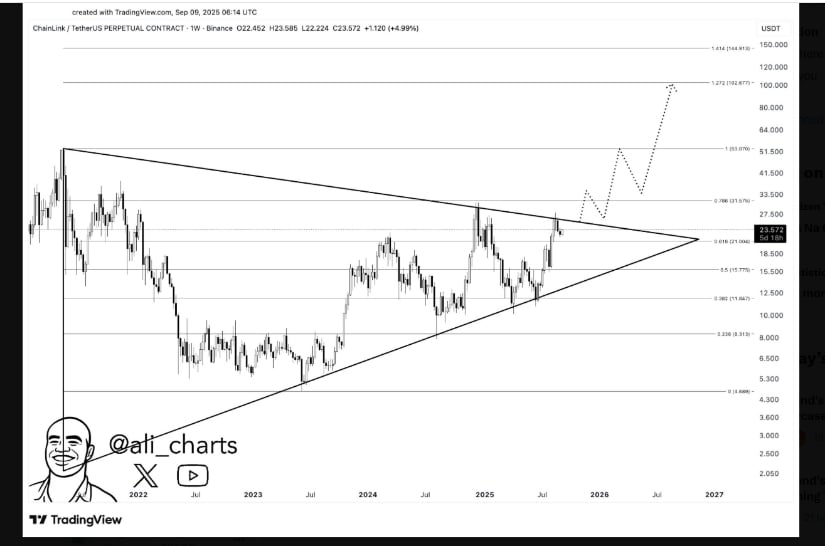
LINKUSD Chart | Source:x
A symmetrical triangle typically indicates that both buyers and sellers are at equilibrium, and a breakout is likely when either side gains control. In this case, analysts point to the possibility of a strong bullish move if the resistance level within the triangle is broken.
The price targets for such a move are indicated by Fibonacci levels, with analysts projecting that the price could surge towards $100.
Historical Comparison with Palantir’s Breakout
Chainlink’s price behavior closely mirrors that of Palantir ($PLTR), which saw a similar accumulation phase before its breakout. The fractal pattern, identified by analyst D.I.Y Investing, shows that both assets underwent a period of consolidation followed by a sharp upward movement. The chart for Chainlink also highlights key accumulation zones marked by yellow and green boxes, where price movements were relatively muted but in an upward direction.
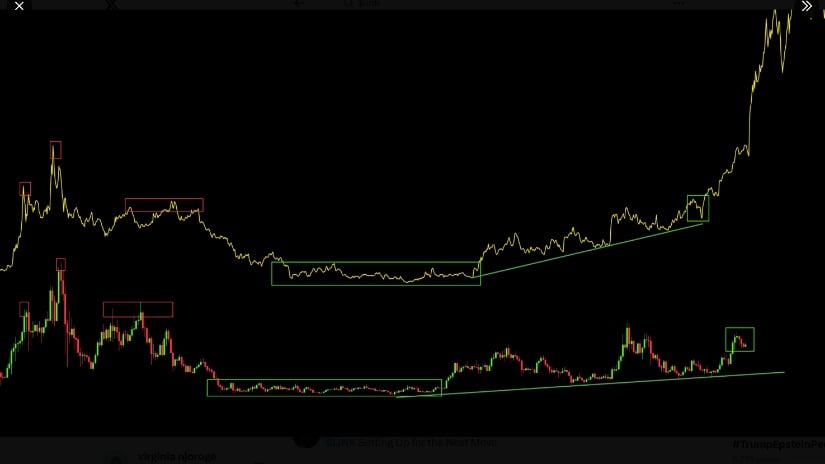
LINKUSD Chart | Source:x
This comparison suggests that Chainlink could follow a similar trajectory to Palantir, which saw significant growth after a prolonged period of consolidation. The consolidation phase, as seen in the symmetrical triangle, could be the precursor to a large price move, potentially aligning with previous breakouts that resulted in substantial gains for Palantir.
Market Price Action and Volume Trends
The recent price action shows minimal fluctuations, with a slight dip to $23.05 observed over the past 24 hours. This range suggests that the asset is consolidating within a tight range before making a decisive move.
Volume data reflects moderate market participation, with a peak observed around 06:00, followed by a decline in trading activity. These signs point to a possible continuation of the current consolidation phase before the altcoin either breaks out or retraces to lower levels.
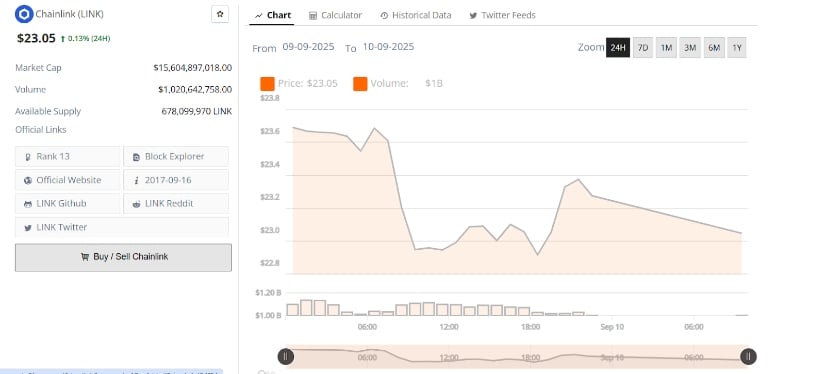
LINKUSD 24-Hr Chart | Source: BraveNewCoin
A breakout above the $23.50 level could trigger an upward movement, while a failure to maintain the support near $23.00 could lead to a decline. The price action and volume data provide important clues about the market’s sentiment and the likelihood of a breakout.
Potential Breakout and Future Outlook
Analysts like Ali have highlighted the importance of the long-term symmetrical triangle pattern in its chart. The triangle, which has been developing since 2022, suggests that the cryptocurrency is poised for a breakout if it clears the resistance within the pattern.
Once this level is breached, the upward momentum could drive the price significantly higher, with analysts forecasting a potential rally toward $100.
Hence, the breakout from the symmetrical triangle could be a game-changer, opening the door to more significant price movements. However, confirmation of the breakout is essential before making any price predictions. The price may experience short-term fluctuations before a breakout, so traders should stay cautious and monitor key technical levels.


 Bengali (Bangladesh) ·
  English (United States) ·