
 2 hours ago
4
2 hours ago
4 
Key Takeaways
$13.70 stopped the latest advance. Ali Charts cited weaker participation signals. CryptoQuant shows recent net exchange inflows. $12.25 is the level to defend.Chainlink’s rally has stalled near its recent high. LINK climbed from a June low near $6.95 to almost $13.70 before retreating toward $12.8. The rejection coincided with signals flagged by Ali Charts: a weekly exhaustion reading, higher exchange balances and less large-holder activity.
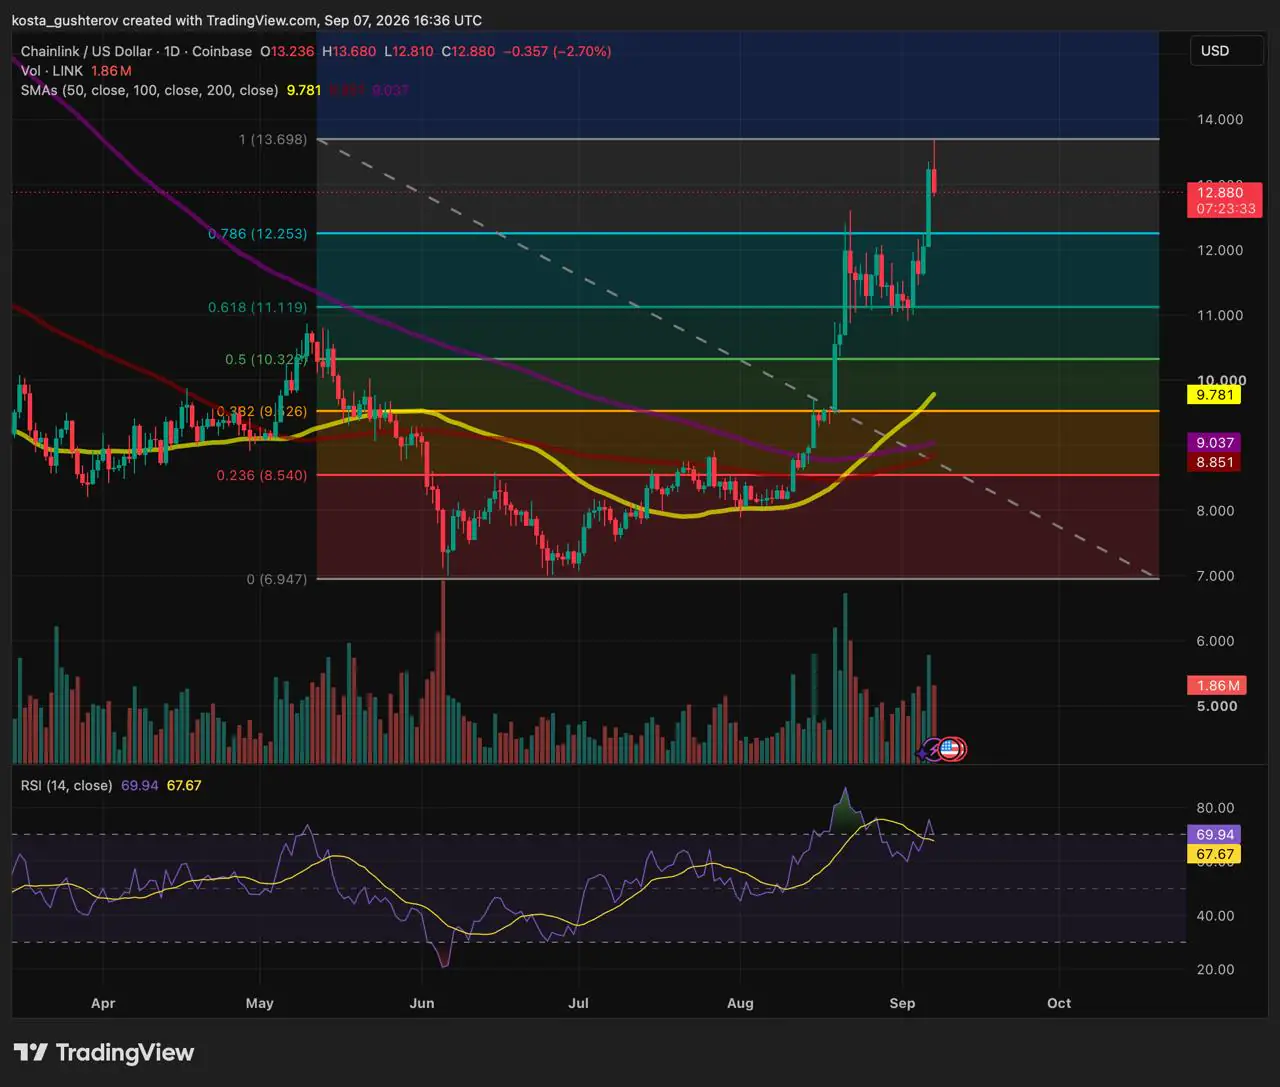 Chainlink (LINK/USD) daily price chart.
LINK had already regained momentum in mid-August, when it reclaimed its major moving averages and put $10 back in view. Its advance also coincided with a wider recovery across large-cap crypto, so no single Chainlink development or on-chain signal can explain the full move.
LINK has reached the high of its current move
The $13.70 area is the high of LINK’s advance from the June low near $6.95. Buyers need to reclaim and hold above it to show that the latest rejection was temporary rather than the start of a larger pullback.
LINK still trades above its 50-, 100- and 200-day moving averages, clustered between roughly $8.85 and $9.78. That leaves the broader recovery intact. The immediate question is whether buyers can defend the first support created by the breakout.
LINK levels that now matter
| $13.7 | Recent rally high. A sustained break above it would extend the recovery. |
| $12.2 | 78.6% Fibonacci level and the first support below the current range. |
| $11.1 | 61.8% retracement and the next major support if $12.25 fails. |
| $10.3 | 50% retracement and a deeper pullback level within the wider recovery. |
Three signals point to a less convincing rally
Ali Charts highlighted a weekly TD Sequential nine after LINK’s roughly 97% rise from the June low. The indicator is used to identify a trend that may be becoming exhausted. It does not predict the size of a correction, or guarantee that one will follow, but the reading carries more weight after such a sharp advance.
Ali also cited Santiment data showing exchange balances rising by about 1.75 million LINK, from roughly 269.25 million to 271 million tokens. At prices near $12.88, that represents close to $23 million in LINK. The figure measures the stock of tokens held on exchanges, not whether those tokens have been sold.
Large transactions worth more than $1 million reportedly fell from around 59 two weeks ago to about 10. That points to less activity from major holders as LINK approaches resistance. It is not enough to call the move distribution, since a lower transaction count can also mean large holders are waiting for a clearer direction.
Netflows show LINK moving onto exchanges
Exchange balances show how much LINK is already held on trading venues. CryptoQuant’s daily netflow data show whether those balances are still growing through recent transfers.
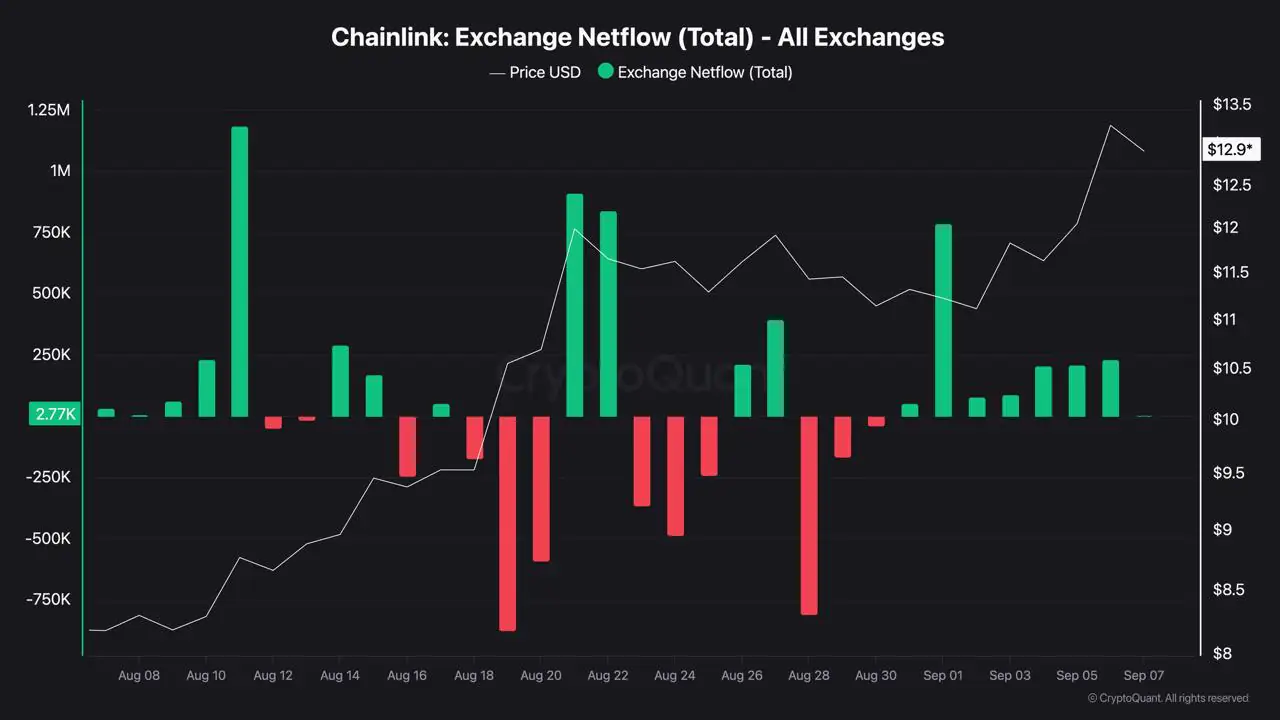
LINK recorded a positive netflow of roughly 780,000 tokens on September 1, followed by smaller positive readings through September 6. That is consistent with more LINK reaching exchanges while price was testing the high. It still does not establish that those tokens were sold: transfers can also reflect market-making, collateral movements or custody arrangements.
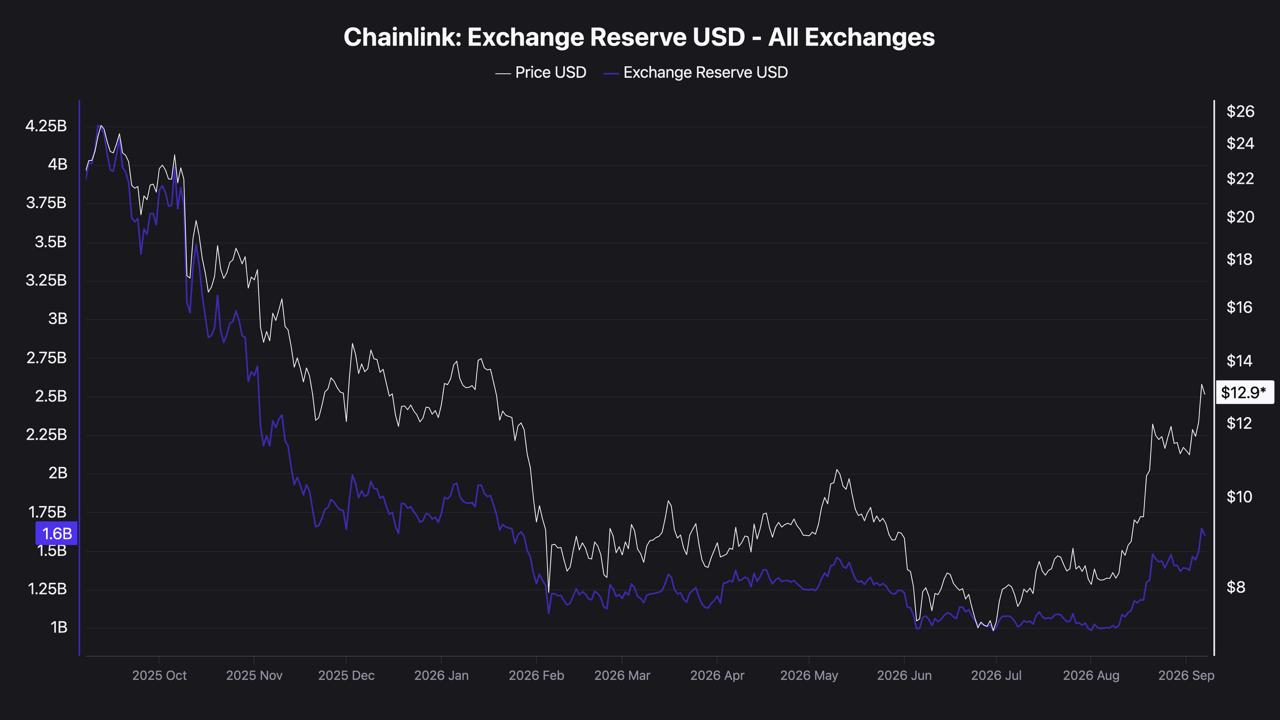
CryptoQuant’s exchange reserve measured in dollars rose to roughly $1.6 billion from around $1 billion in early August. That should not be counted as separate evidence of token inflows. LINK’s own price rose sharply over the same period, so the dollar value of reserves can increase even when the number of tokens on exchanges does not.
Network adoption has continued during the rally
The exchange data describe short-term supply. Circle’s addition of Chainlink Proof of Reserve to cirBTC is a separate part of the picture, giving users a way to monitor the token’s disclosed Bitcoin reserves onchain. It supports Chainlink’s infrastructure case, but it does not show whether spot demand will defend $12.25.
LINK’s setup is also not isolated from the rest of the market. The token rose during a broader rebound in major cryptocurrencies. A fresh Bitcoin-led sell-off could therefore test LINK’s support even if Chainlink’s adoption outlook remains unchanged.
$12.25 decides whether this is a pause or a cooldown
Holding above $12.25 would leave LINK in position to retest $13.70. A sustained move through the recent high would show that the rejection was only a pause in the recovery.
The bearish case becomes stronger if LINK loses $12.25 while exchange netflows remain positive. That combination would show a failed support level alongside a larger supply of tokens reaching exchanges, putting $11.1 and then $10.3 in focus.
This article is for informational purposes only and does not constitute financial advice.
The post Chainlink Price About to Cool Down? Warning Signs Start Flashing appeared first on Coindoo.





 Bengali (Bangladesh) ·
  English (United States) ·