
 1 month ago
14
1 month ago
14 
A chart from Ecoinometrics visualizes Bitcoin’s past halving cycles and explores the potential trajectory if this current cycle follows historical patterns.
What History Tells Us
Each Bitcoin halving reduces the reward miners receive, slowing the issuance of new BTC and tightening supply. Historically, this has preceded dramatic price increases:
After the 1st halving (2012), BTC soared. After the 2nd halving (2016), it reached new all-time highs. The 3rd halving (2020) saw Bitcoin climb to nearly $70,000.The 4th Cycle Begins
The chart starts this new halving cycle at $63,000, with potential outcomes projected based on the previous three cycles:
Conservative projection (3rd halving pattern): ~$140,000 Moderate projection (2nd halving pattern): ~$500,000 Aggressive projection (1st halving pattern): Up to $4.5 million per BitcoinWhile that upper range might seem extreme, Bitcoin’s history is filled with unexpected surges — often far surpassing mainstream expectations.
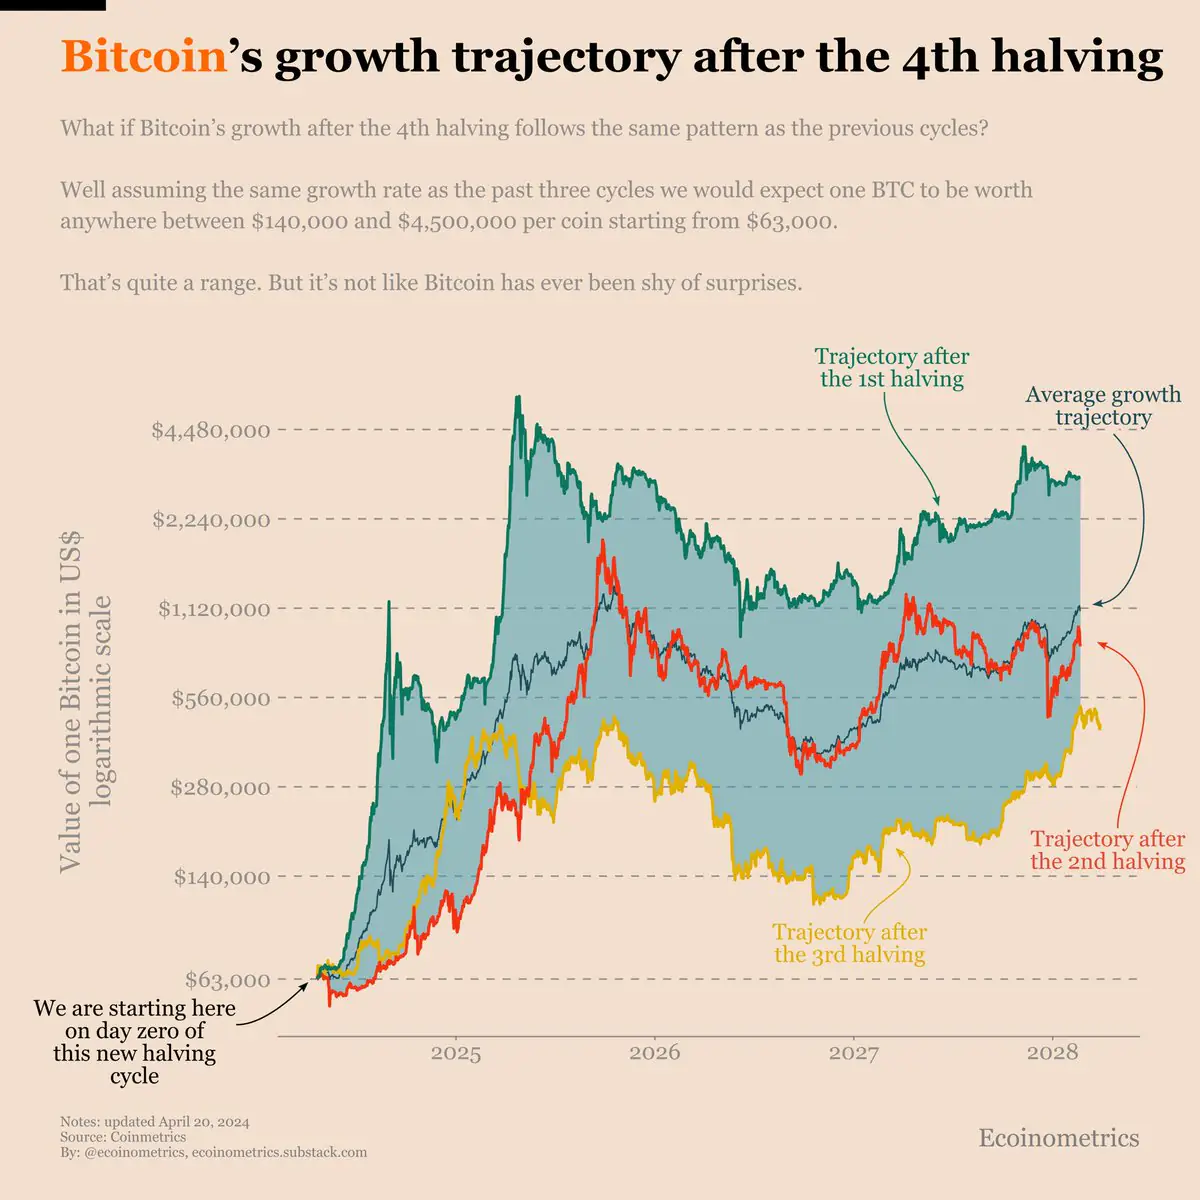
The Trajectory Zone
The shaded blue region on the chart represents the average growth band based on prior cycles. So far, Bitcoin appears to be tracking in line with past behavior, maintaining upward momentum within the historical growth envelope.

What This Means for Investors
The wide range of possible outcomes underscores Bitcoin’s volatile but powerful growth potential. Whether BTC reaches six figures or defies all predictions to approach seven figures, the post-halving cycle remains one of the most closely watched periods in crypto.
One thing is clear: Bitcoin has never been shy of surprises — and the next few years could be historic.
The post Bitcoin’s 4th Halving: Could BTC Reach $4.5M? appeared first on Coindoo.


 Bengali (Bangladesh) ·
  English (United States) ·