
 3 months ago
21
3 months ago
21 
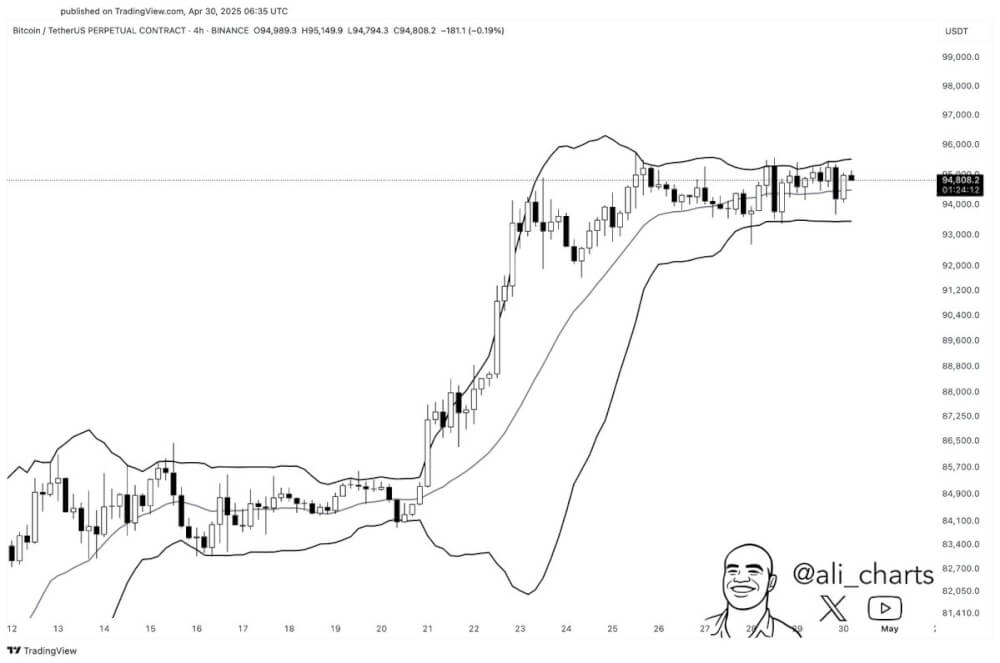
In a tweet posted early this morning, Ali highlighted that the Bollinger Bands are “squeezing” on the 4-hour chart for Bitcoin (BTC), a classic technical signal that often precedes heightened volatility.
What the Chart Shows
The accompanying chart, taken from TradingView, displays Bitcoin’s recent price action on a 4-hour timeframe. The chart shows a consolidation phase where price is trading sideways between roughly $93,000 and $95,000. More importantly, the Bollinger Bands have contracted significantly during this range-bound movement.
This “squeeze” is visually evident — the upper and lower bands are drawing closer together, suggesting that volatility has dropped to a low point. Historically, such squeezes precede powerful breakouts — either upward or downward — depending on how the market resolves the consolidation.
What This Means for Bitcoin
Bitcoin’s current squeeze on the 4-hour chart suggests that traders should prepare for a potential breakout. While the direction is uncertain, the tight range between $93,000 and $95,000 serves as a key battleground. A break above or below this zone, particularly with strong volume, could trigger the next significant trend.
Key Levels to Watch
Resistance: Around $95,000 — a breakout here could trigger bullish momentum. Support: Around $93,000 — a drop below this level might lead to further downside.
Understanding Bollinger Bands
Bollinger Bands are a popular technical analysis indicator developed by John Bollinger. They consist of three lines:
Middle Band: A simple moving average (typically 20-period). Upper Band: Two standard deviations above the middle band. Lower Band: Two standard deviations below the middle band.These bands expand and contract with market volatility. When the price becomes more volatile, the bands widen. When the price consolidates, the bands tighten — forming what traders call a “squeeze.”
A squeeze itself doesn’t predict the direction of the breakout but signals that a move is coming. Traders often wait for a strong breakout from the squeeze zone — confirmed by high volume — before entering a trade.
Conclusion
While no indicator can predict market direction with certainty, Bollinger Band squeezes are time-tested setups that often precede major price action. Bitcoin’s tightening 4-hour chart should have traders on high alert for a breakout. Whether bullish or bearish, the next move could be fast and decisive.
The post Bitcoin Price Poised for a Breakout, According to Important Indicator appeared first on Coindoo.


.jpg.webp?itok=1zl_MpKg)


 Bengali (Bangladesh) ·
  English (United States) ·