
 1 month ago
14
1 month ago
14 
This rally has been marked by noticeable sideways accumulation phases before each significant move higher. This stair-stepping pattern is evident in the Cost Basis Distribution (CBD) heatmap, which illustrates the supply clusters that have accumulated at similar price levels over the past three months. 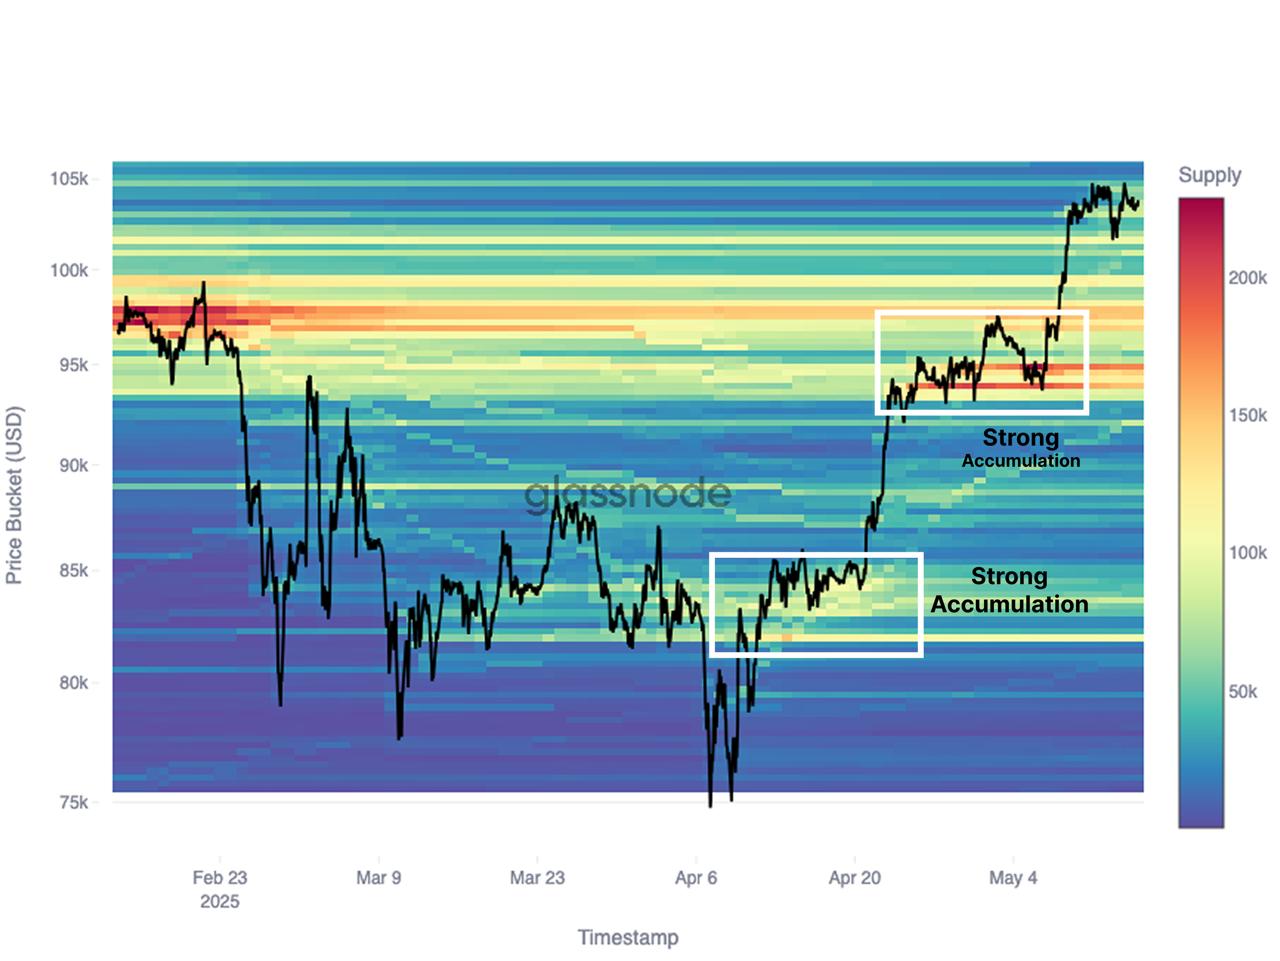
Accumulation Phases and Market Movements
The CBD heatmap reveals the accumulation regimes that formed ahead of each leg higher, culminating in BTC’s recent move to $104k. This consistent pattern of accumulation at various price levels highlights a steady buildup of demand, signaling market confidence and strong buying pressure.

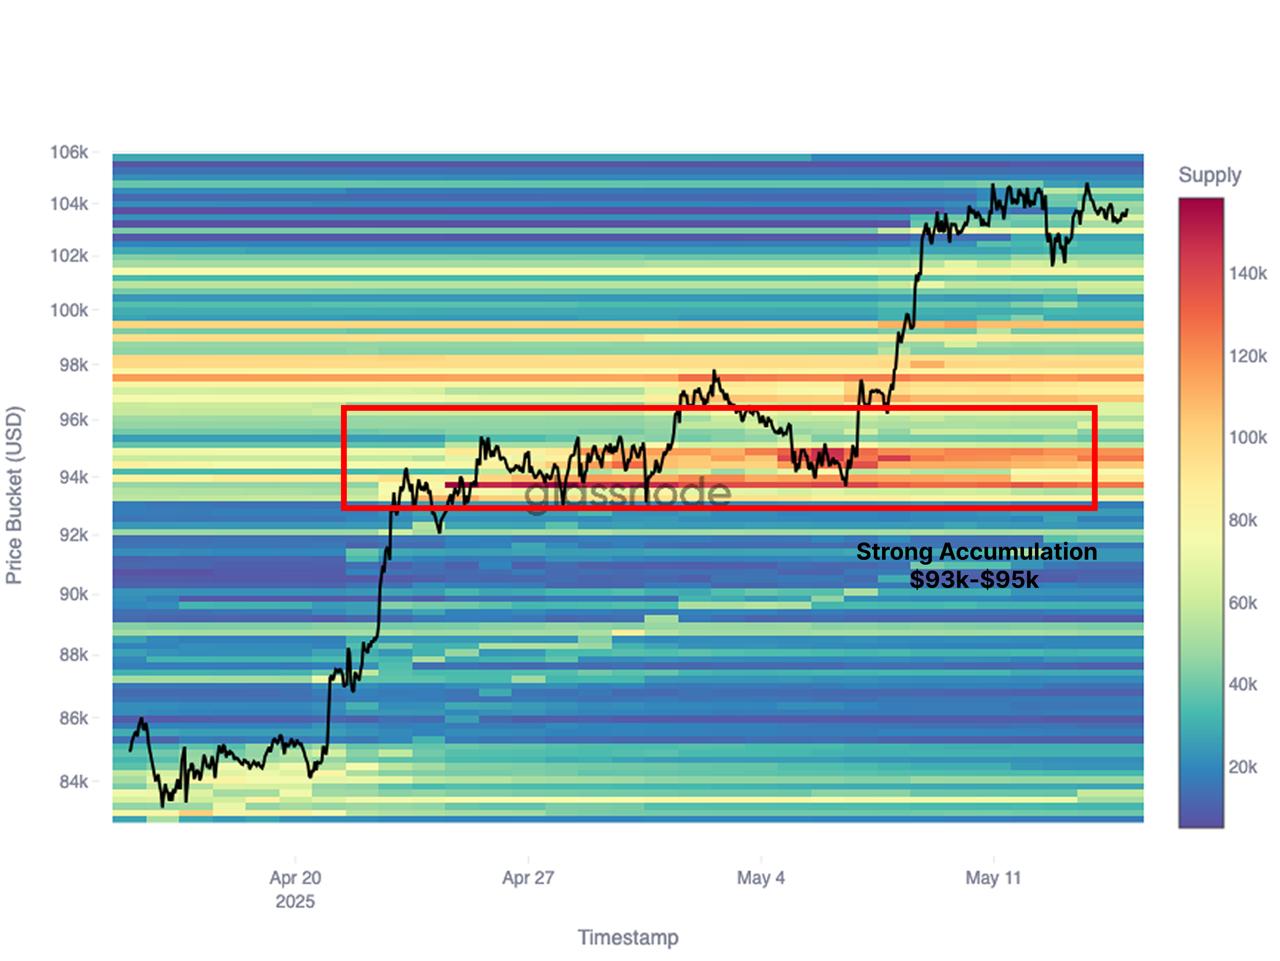
Key Accumulation Zone Between $93k and $95k
Zooming in on the last 30 days, a key accumulation zone has emerged between $93k and $95k. This range closely aligns with the Short-Term Holder cost basis, which reflects investors who entered the market within the past 155 days. As a result, this zone is likely to serve as a critical support level should the market experience any short-term pullbacks. It represents a demand zone where investors are likely to see value, reinforcing the market’s bullish momentum.
The post Bitcoin Markets Show Strong Spot Demand appeared first on Coindoo.


 Bengali (Bangladesh) ·
  English (United States) ·