
 4 months ago
21
4 months ago
21 
In a recent tweet, prominent trader Ali (@ali_charts) highlighted the importance of this level. As shown in the accompanying chart, the yearly open sits at $94,264 — a price point Bitcoin has revisited after a period of volatility throughout the beginning of the year. The chart reveals a range of price movements, marked by key points that served as strong support levels during the earlier months of 2025.
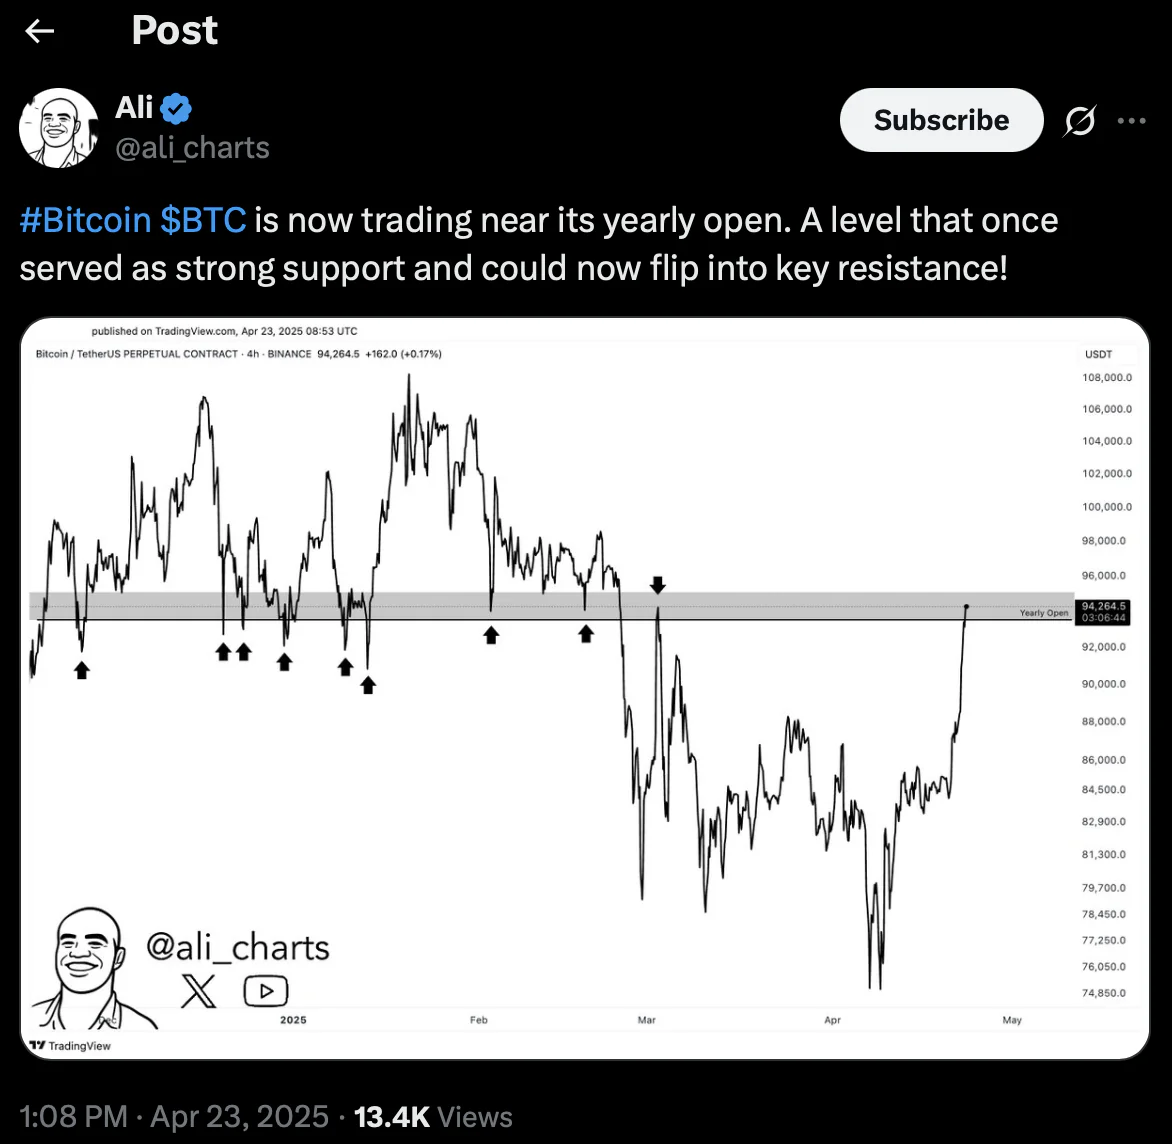
However, there’s a significant possibility that this same level could now flip from support into key resistance. Such a scenario would be crucial for market participants to watch, as the ability of Bitcoin to sustain above this level could indicate further upward momentum. On the other hand, failure to break past this threshold may lead to a potential price correction.
The chart illustrates that BTC has been oscillating around this level for several months, creating a dynamic where traders are looking for clear signs of either continuation or reversal. With Bitcoin now testing this yearly open, the market’s next moves could prove decisive.

For anyone invested in Bitcoin or following the cryptocurrency market closely, understanding how this level plays out could provide insight into the future direction of Bitcoin’s price. Traders will be keeping a close eye on whether the previous support holds or if it now turns into formidable resistance.
The post Bitcoin Faces Critical Test: Will the Yearly Open Flip from Support to Resistance? appeared first on Coindoo.


.jpg.webp?itok=1zl_MpKg)


 Bengali (Bangladesh) ·
  English (United States) ·