
 2 months ago
18
2 months ago
18 
One of the key indicators to gauge sentiment in the derivatives space is the open interest (OI) in perpetual futures markets, denominated in BTC. By tracking the weekly changes in OI across major platforms, we can see whether speculators were caught off guard by price movements.
Open Interest and Market Reactions
Since January 2025, the OI metric has proven useful in identifying moments when market participants were surprised by Bitcoin’s movements. During the drop below $80k, OI contracted by more than 10% per week, indicating that over-leveraged long positions were being liquidated as prices neared liquidation levels.
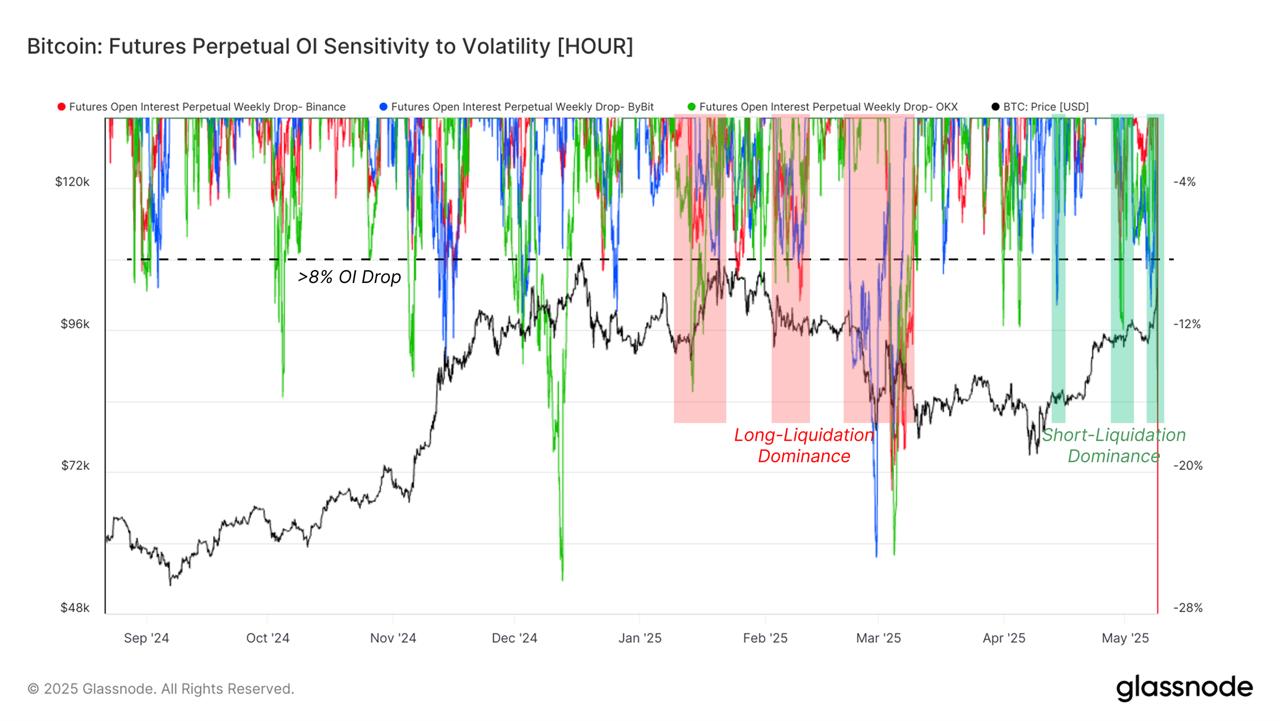
In contrast, a similar dynamic unfolded during the recent rally above $90k, where OI also contracted. However, this time, the contraction indicated a short-side squeeze.
These shakeouts—where excessive leverage is purged—are typical in the early phases of a new market trend. The short squeeze in particular suggests that the rally has eliminated excessive short positioning, creating a healthier foundation for further upward movement.
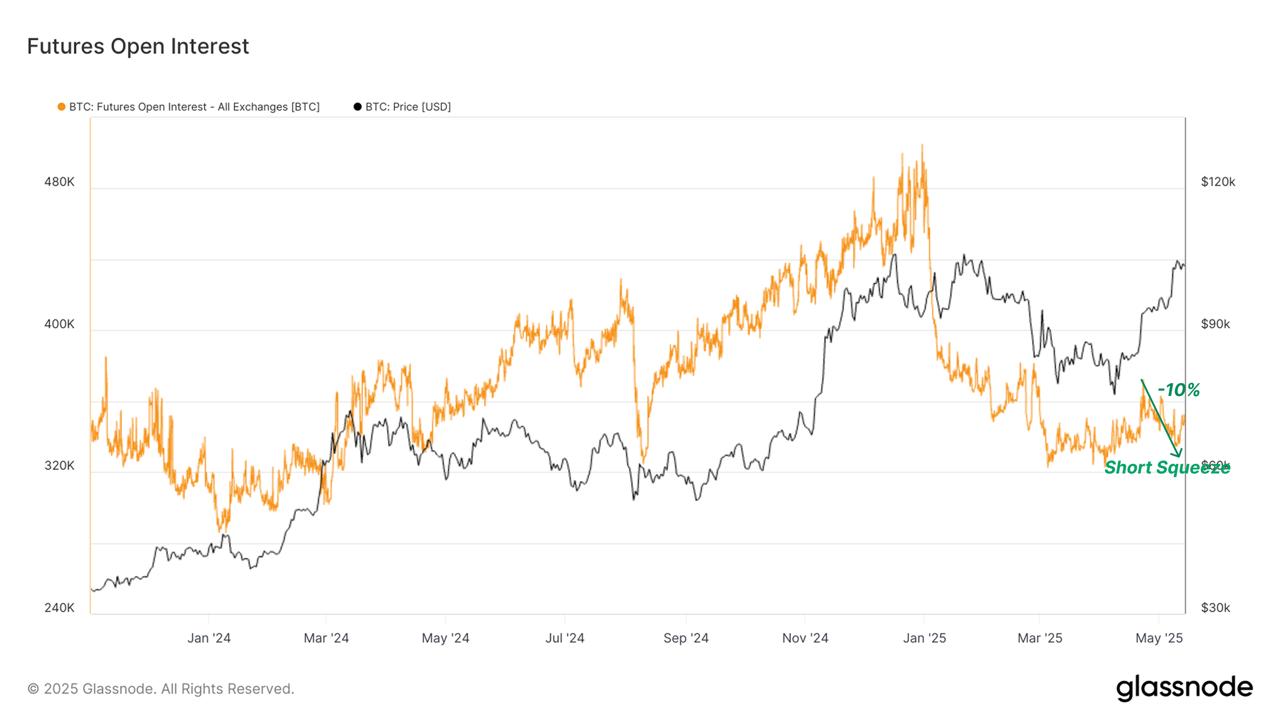
Futures Market Adjustments and Short Squeeze
As short positions were flushed out, futures open interest declined by 10%, dropping from 370k BTC to 336k BTC. This reduction gives insight into the scale of the short squeeze and reduces the likelihood of a sudden deleveraging event, which would otherwise contribute to higher volatility in the near term.

Another key indicator of market sentiment in the derivatives space is the funding rate, which reflects the directional bias of perpetual futures markets. Over the past few weeks, the funding rate has remained remarkably neutral despite the bullish price action, signaling that leveraged long positions are not yet excessive.
Since late April, funding rates have been steadily recovering, hovering around 0.007% (approximately 7.6% annually). This positive shift suggests a healthy appetite for long positions without excessive leverage, indicating a stable outlook in the derivatives market.
Options Market: A Growing Bullish Sentiment
Further insight into market sentiment can be found in options market data, specifically the 1-Month 25 Delta Skew. This metric measures the difference in implied volatility (IV) between 25-delta puts and 25-delta calls. A negative skew suggests that calls are more expensive than puts, which typically reflects a more aggressive stance on upside movement—indicative of bullish sentiment.
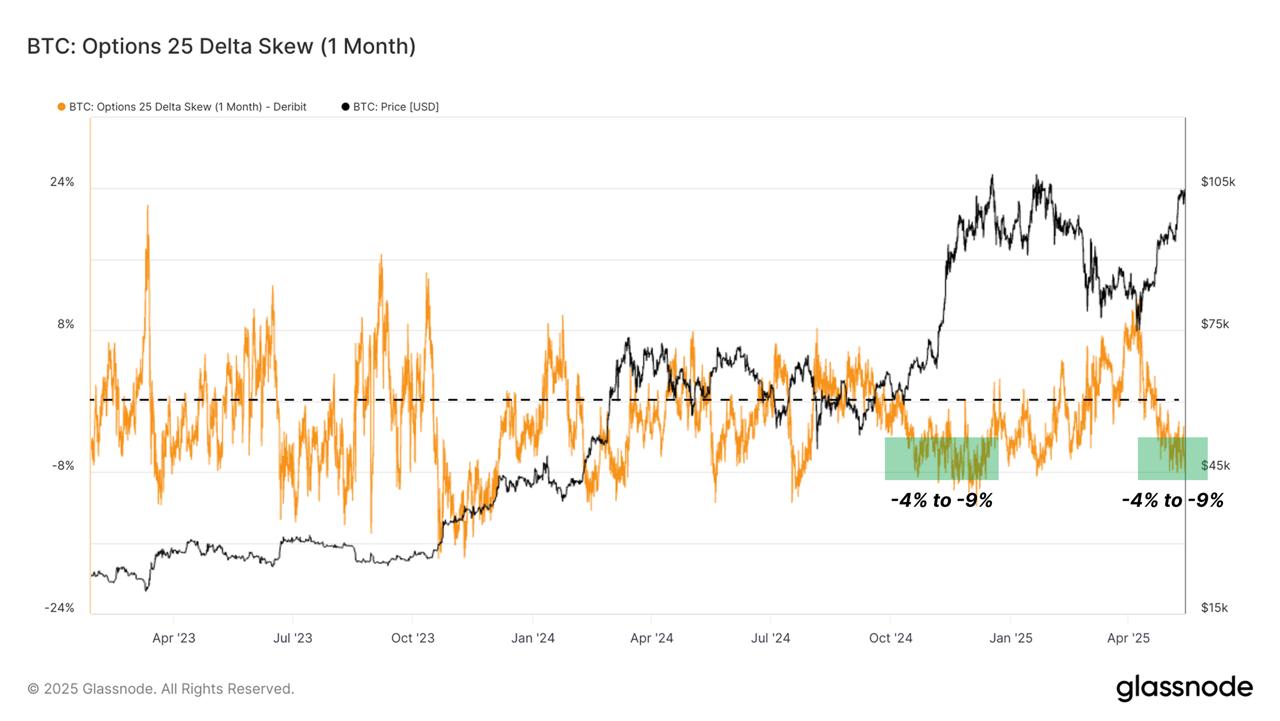
Currently, the 25 Delta Skew (1M) is at -6.1%, meaning call options are more expensive than put options. This shift toward a risk-on behavior reflects growing bullish speculation in the options market.
While not a definitive indicator, a sustained negative skew, especially after a significant move higher, is a sign of rising optimism.
For the options market to stay aligned with the bullish spot dynamics, we would want to see the skew remain below or around neutral. This would further bolster confidence in the strength of the rally.
The post Bitcoin: Derivatives Markets Lag as Spot Rally Strengthens appeared first on Coindoo.


.jpg.webp?itok=1zl_MpKg)


 Bengali (Bangladesh) ·
  English (United States) ·