
 2 months ago
30
2 months ago
30 
TLDR
Bitcoin trades in an ascending symmetrical triangle with breakout potential targeting $123,731-$150,309 Bollinger Bands indicator reaches most extreme monthly level since 2009, suggesting explosive price movement ahead Trump calls for aggressive 100 basis point Fed rate cut, adding macro tailwinds to Bitcoin outlook Cup-and-handle pattern on monthly chart targets $305,000 for 2025-2026 timeframe Metaplanet announces $1.4 billion Bitcoin purchase plan while ETF inflows turn positiveBitcoin price currently trades at $112,236 as multiple technical indicators suggest a major price movement may be approaching. The cryptocurrency maintains its position within an ascending symmetrical triangle formation.
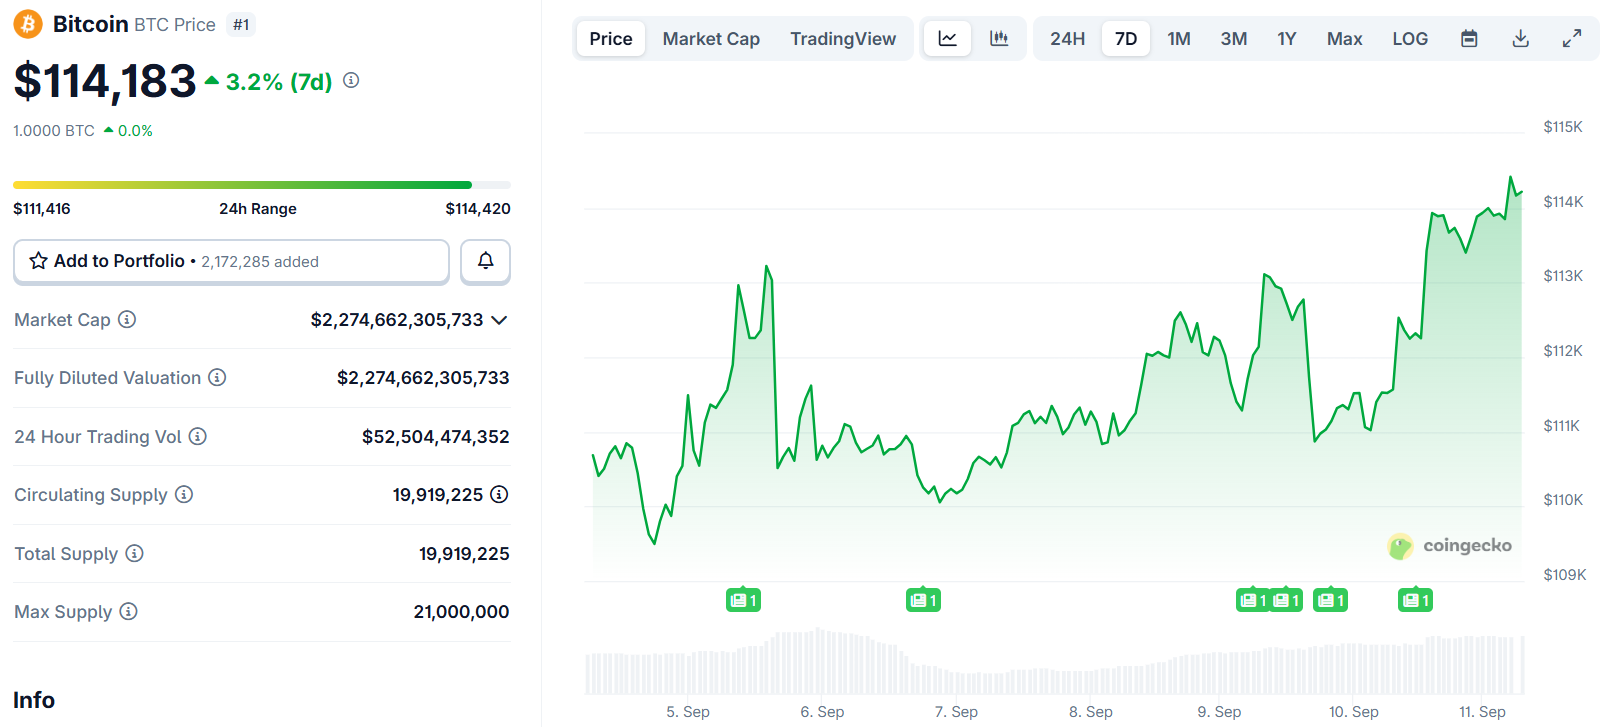 Bitcoin (BTC) Price
The lower support trendline holds near $107,304 while resistance sits around $117,156 at the 0.618 Fibonacci level. A breakout above this range could push Bitcoin toward $123,731 at the 1.0 Fibonacci extension.
Technical analysts point to the 1.618 extension at $133,882 as the next target beyond that level. The 2.618 Fibonacci level at $150,309 represents a longer-term bullish target.
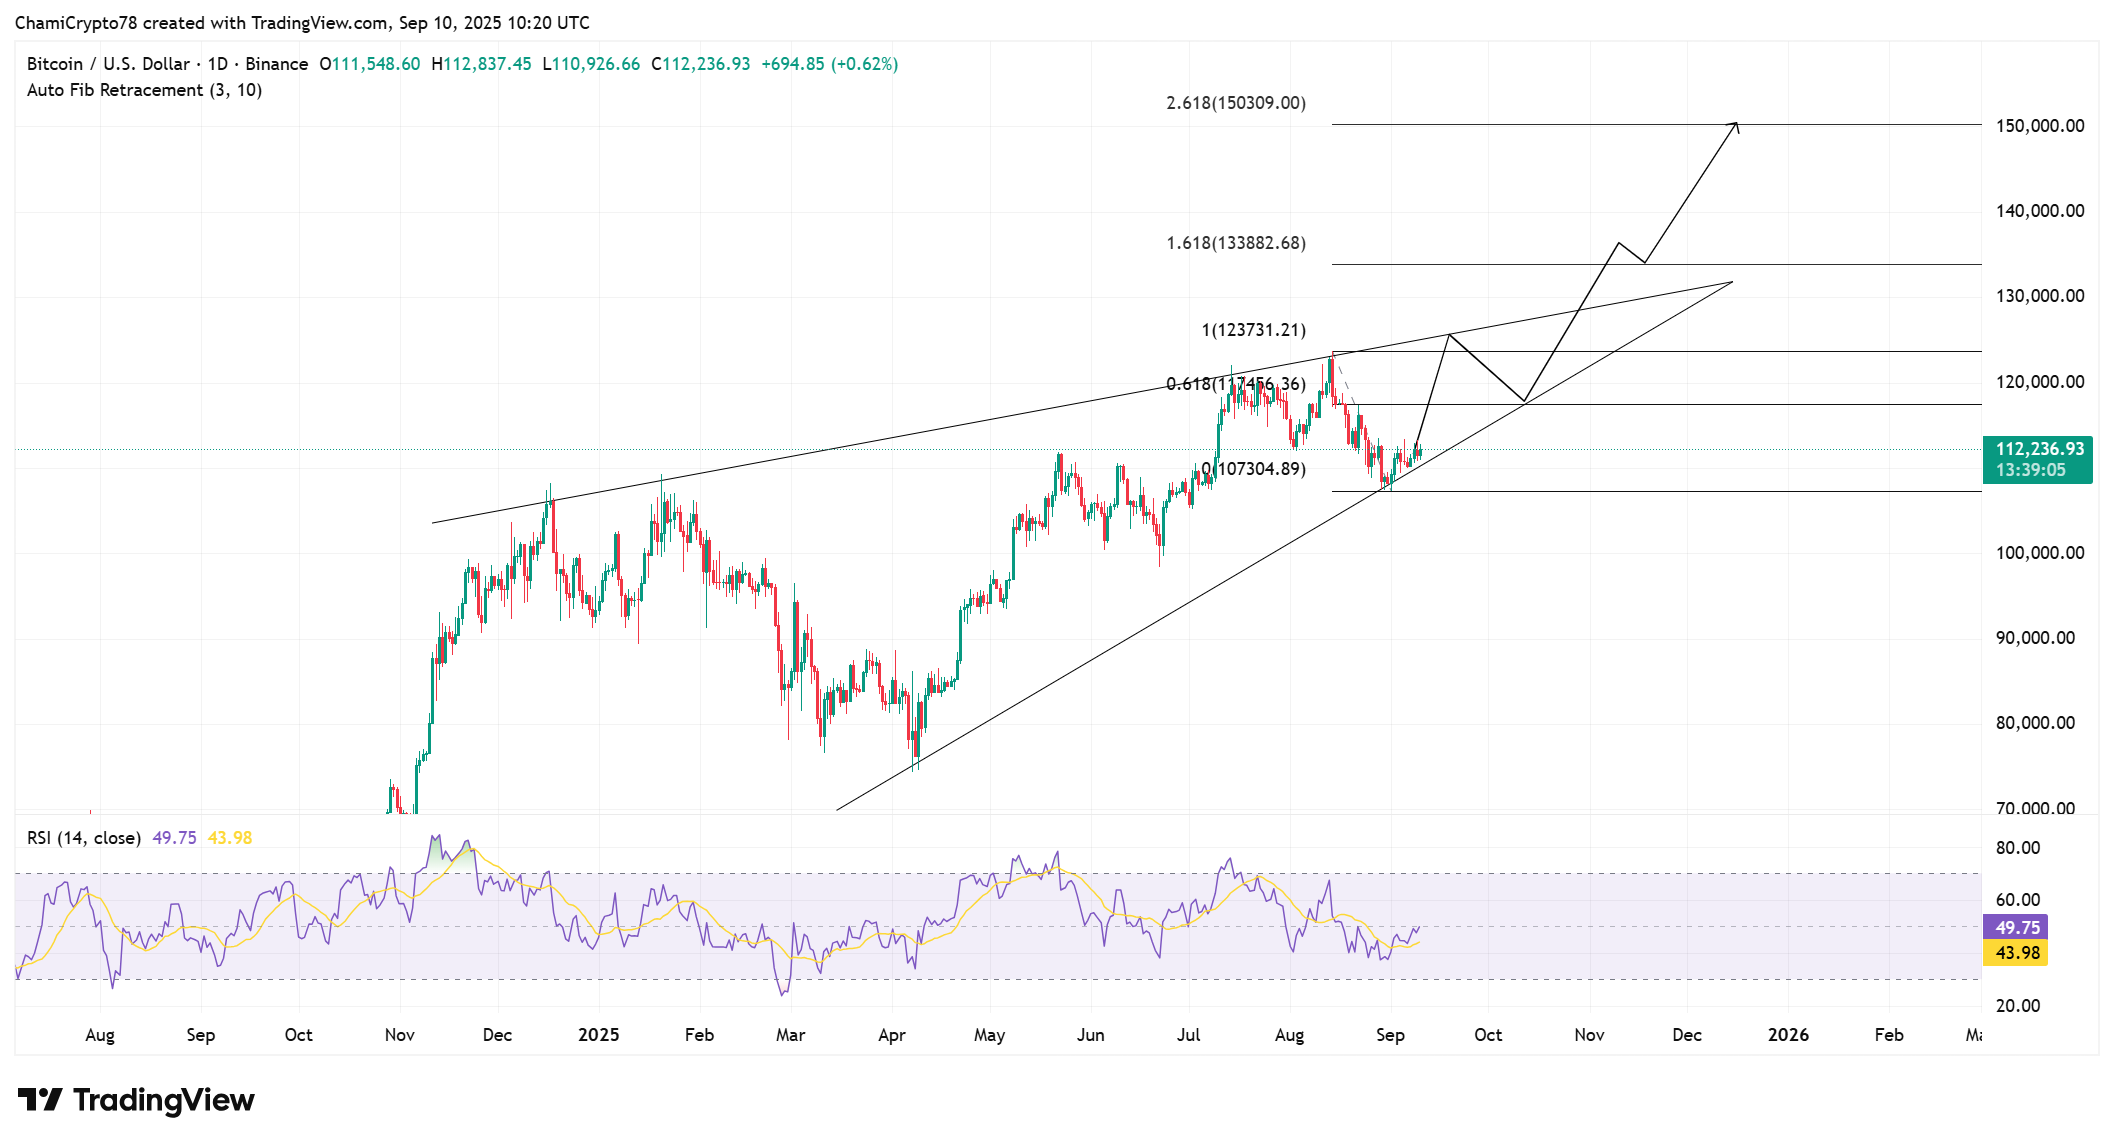 Source: TradingView
The RSI currently reads 49.75, positioned above the signal line at 43.98. This provides bullish confirmation that aligns with the triangle structure.
Bitcoin Price Prediction
Bitcoin’s Bollinger Bands have reached their most extreme level on the monthly timeframe since January 2009. This volatility indicator measures momentum within a specific range.
Crypto analyst Matthew Hyland identified this critical pattern. Previous contractions in 2012, 2016, and 2020 all preceded explosive price expansions.
#BTC Monthly Bollinger Bands now at the most extreme level in its entire history: pic.twitter.com/Lxhe7JYRYu
— Matthew Hyland (@MatthewHyland_) September 8, 2025
The current setup appears even tighter than historical precedents. This suggests potential for the largest Bitcoin price move on record.
Multiple traders have spotted the emerging pattern. Analyst Crypto Ceasar noted the historical tightness typically leads to heavy upside volatility.
The Bollinger Bands on the 1M (monthly) are at historical tightness. This has previously led to heavy volatility to the upside (see chart).
Bitcoin could be in for a spicy Q4 🐂🫡 pic.twitter.com/sOmeLIYPgT
— 👑Crypto Caesar👑™️ (@crypto_caesar1) September 6, 2025
Political Pressure on Fed Policy
Donald Trump has called for an aggressive 100 basis point Federal Reserve rate cut ahead of the upcoming FOMC meeting. He criticized Jerome Powell for acting too late on monetary policy.
The weak August jobs report showed only 22,000 new positions versus 75,000 expected. Unemployment now sits at 4.3%, reaching a four-year high.
Markets currently price in a smaller 25 basis point cut next week. Trump’s stance has amplified speculation about deeper rate reductions.
His push for multiple cuts over coming months has drawn market attention. Such moves could provide indirect support for Bitcoin price.
Metaplanet announced plans to use $1.4 billion from its capital raise to purchase Bitcoin. This expands the company’s reserves through institutional demand.
Bitcoin’s cup-and-handle pattern on the monthly chart shows a breakout above the neckline at $69,000 in November 2024. The cryptocurrency continues validating this technical breakout.
The pattern’s maximum target sits around $305,000 for the 2025-2026 timeframe. This represents over 170% upside from current price levels.
Spot Bitcoin ETF inflows turned positive on Monday after recent outflows. Market intelligence firm Santiment noted money moving back into Bitcoin ETFs at a rapid rate.
Previous crypto rallies received boosts from similar inflow spikes. Retail investors appear to be dropping out while institutional money returns.
The post Bitcoin (BTC) Price Prediction: Fed Rate Cut Hopes Build as Triangle Breakout Setup Targets $150K appeared first on CoinCentral.


 Bengali (Bangladesh) ·
  English (United States) ·