
 2 months ago
43
2 months ago
43 
TLDR
Bitcoin fell over 3% this week to $111,590, breaking below 50-day and 100-day moving averages for the first time since April Monday saw $1.62 billion in long position liquidations, the largest single-day liquidation for the year Social media “buy the dip” mentions surged to highest level in nearly a month, viewed as contrarian signal by analysts Liquidation heatmaps show largest liquidity cluster at $107,000, which could act as price magnet Retail traders and whales increased leverage long positions during the selloff, but selling pressure continuesBitcoin has experienced its most challenging week in months as the cryptocurrency broke below key technical levels that had supported its price since April.
The world’s largest cryptocurrency dropped over 3% this week to $111,590. This decline pushed Bitcoin below both its 50-day and 100-day simple moving averages.
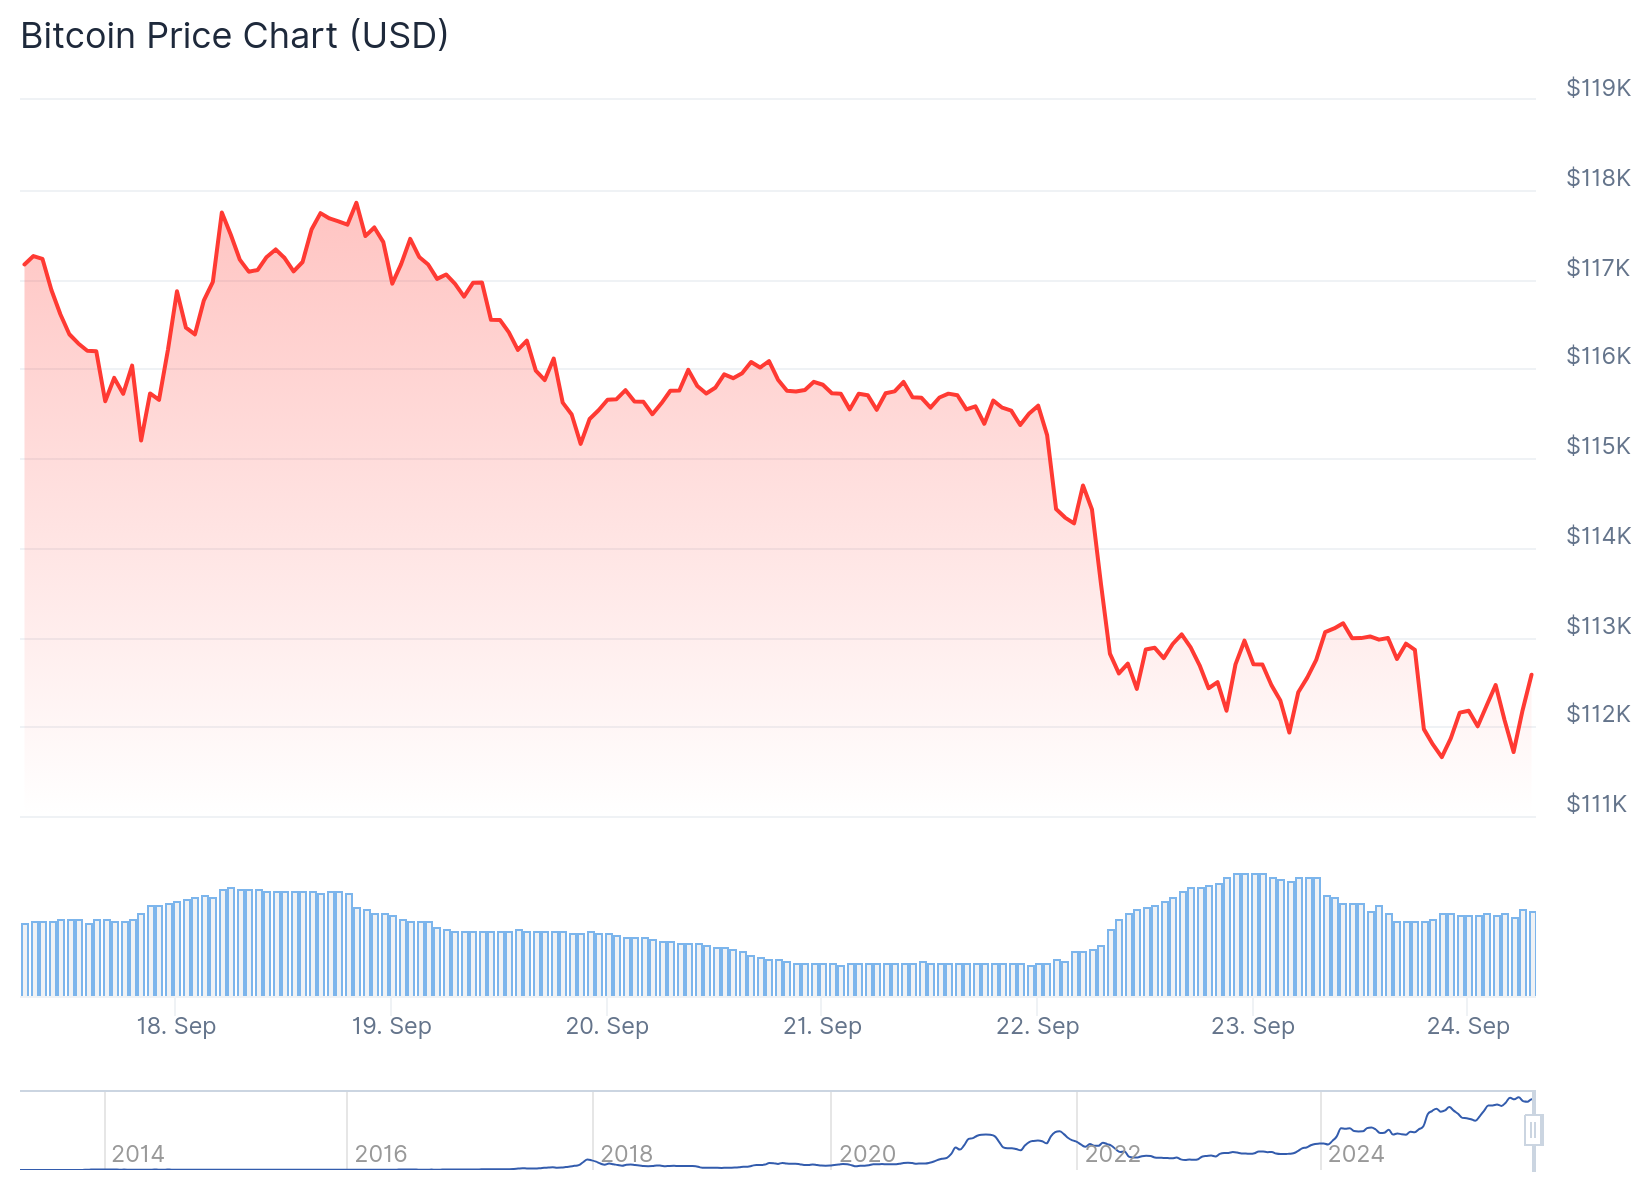 Bitcoin (BTC) Price
Both moving average indicators have lost their upward momentum for the first time since April. They are now flatlining, which technical analysts view as a cautionary signal for bulls.
Monday marked a particularly difficult day for Bitcoin traders. The crypto market witnessed its largest single-day long position liquidation of the year.
A total of $1.62 billion in long positions were liquidated during Monday’s session. This massive liquidation event highlighted the leverage that had built up in the market.
Despite the selloff, data shows that both retail traders and whale-sized investors have been buying the dip. The True Retail Longs and Shorts Account data from Binance reveals increased leverage long positions since Monday’s decline.
Social Sentiment Turns Contrarian
Social media activity has shown a surge in “buy the dip” mentions across platforms. Data from Santiment shows these mentions have reached their highest level in nearly a month.
📊 Since Bitcoin's all-time high six weeks ago, bullish traders have been frustrated by the lack of sustained price bounces. We take a look at the encouraging whale accumulation, declining $BTC on exchanges, and "buy the dip" enthusiasm in our latest. 👇https://t.co/Fw9P9ihfVd pic.twitter.com/fh5RniwRWK
— Santiment (@santimentfeed) September 22, 2025
The platform tracks these mentions across Reddit, Telegram, and X using its social trends indicator. This metric analyzes the volume of relevant keywords and phrases.
Santiment views the spike in “buy the dip” mentions as a contrarian signal. The platform suggests that when retail sentiment becomes overly optimistic, prices often move in the opposite direction.
“Prices typically move in the opposite direction of the crowd’s expectations,” Santiment noted. The platform suggests more downside could occur before a meaningful bottom forms.
Technical Analysis Points Lower
Aggregate cumulative volume delta data from Hyblock shows sellers continuing to dominate price action. This data elevates the probability of a deeper selloff toward range lows.
Hello again 👋
Let's get straight to it. Where is the liquidity below?
– 111k-112k (small cluster, but growing)
– 108.8k-109k (larger cluster, and also growing)
– 107k (largest cluster).
*growing = magnet, because it implies recent liquidity is building. pic.twitter.com/8rrgwlYZCN
— Hyblock (@hyblockcapital) September 23, 2025
Order book liquidity analysis reveals the deepest liquidity cluster at $107,000. According to Hyblock Capital, this level can act as a magnet, potentially pulling prices down.
Smaller but growing liquidity pools are also visible at $109,000 and $111,000. These levels represent areas where traders have placed orders.
Bitcoin liquidation heatmaps show the price moving through underlying bid liquidity. A larger cluster of potential liquidations sits at the $107,000 level.
Market Structure Analysis
Open interest in Bitcoin futures has fluctuated within a $46 billion to $53 billion range since late July. This range has remained relatively stable despite recent volatility.
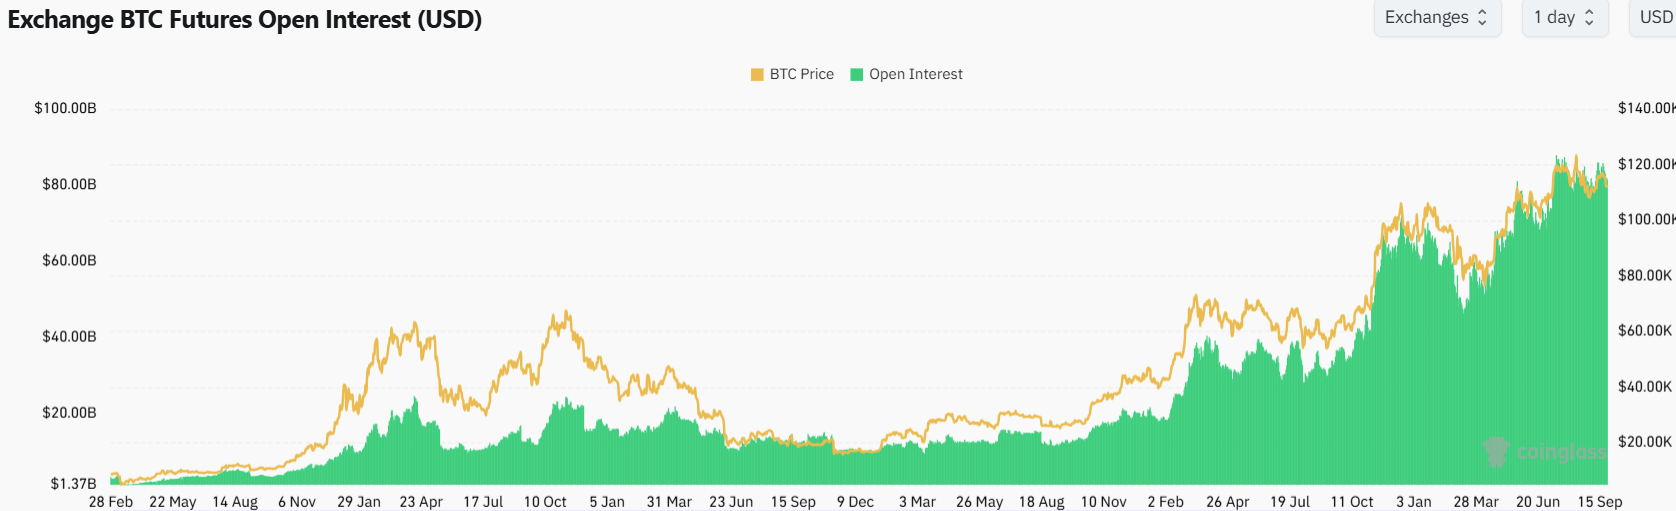 Source: Coinglass
Spot market volumes and aggressive use of long leverage in perpetual futures markets remain largely absent. This lack of aggressive buying creates challenges for sustained price recovery.
The current market dynamics show that day-to-day price action has been primarily driven by the perpetual futures market. Spot markets have shown limited engagement during recent price movements.
Despite buyers showing some appetite in Bitcoin’s current range, bulls face continued challenges. The selling pressure has not completely dissipated as Bitcoin attempts to consolidate.
Current data shows Bitcoin trading around $112,495 as market participants continue to monitor key support levels at $107,000 and $106,000.
The post Bitcoin (BTC) Price: Dip Buyers Emerge but Charts Point to Potential Drop to $107,000 appeared first on CoinCentral.


 Bengali (Bangladesh) ·
  English (United States) ·