Contents
Here Is Where The Crazy Upward Move Comes Need More Calendars Getting More Theta Exiting The Trade – January 9, 2024 ConclusionBefore getting into this article, be familiar with the Rhino trading guidelines presented in our previous article so that you understand that we start with a broken-wing butterfly and then scale in with another set of broken-wing-butterflies higher up as the price of the RUT goes up.
In this example, the Rhino was entered with two contracts on December 4, 2023, with 74 days till expiration.
Date: December 4, 2023
Price: RUT @ $1867.92
Buy two February 16 RUT $1870 put @ $56.26
Sell four February 16 RUT $1830 put @ $41.00
Buy two February 16 RUT $1780 put @ $27.10
Net debit: -$272
On December 8, when the price of RUT ran up to 1887, we scaled into the full Rhino.
Date: December 8
Price: RUT @ $1887.50
Buy two February 16 RUT 1890 put @ $58.68
Sell four February 16 RUT 1850 put @ $42.29
Buy two February 16 RUT 1800 put @ $27.46
Net debit: -$312
Here Is Where The Crazy Upward Move Comes
On December 13, 2023, there was an FOMC meeting in which the market responded with another strong rally.
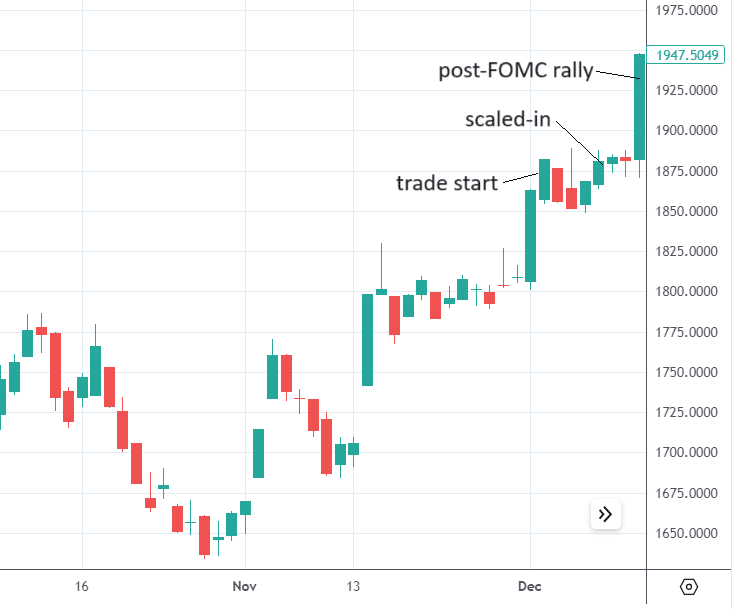
The payoff graph looks like this after the FOMC meeting:
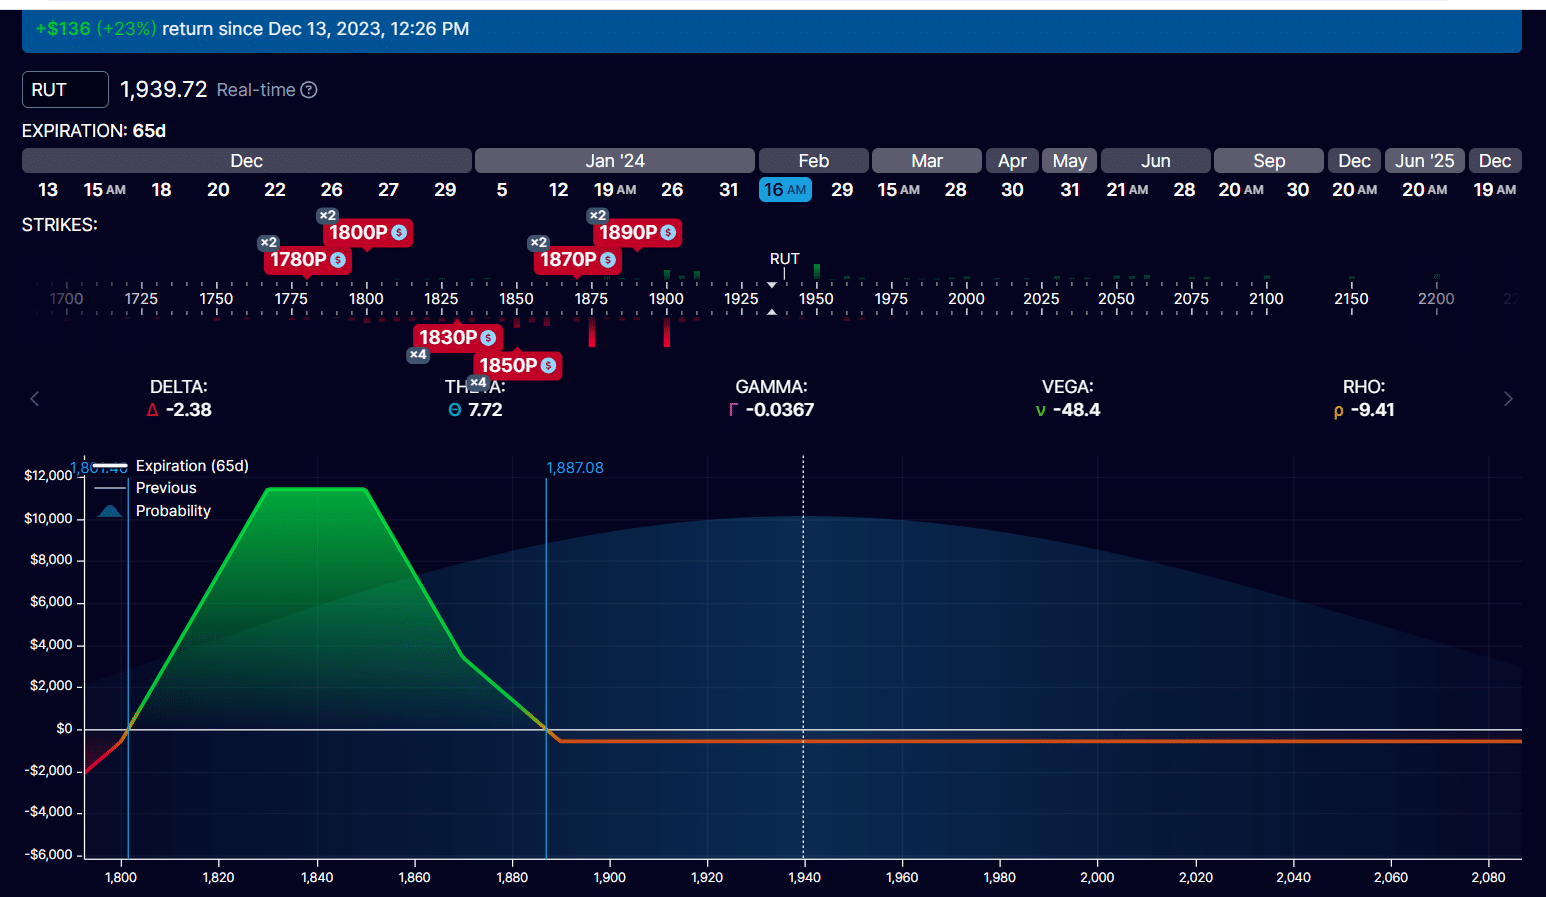
The day before, the price of the RUT was still inside the tent at 1880.
And now the price of the RUT ran all the way up to 1940, where the white vertical line is.
That is way above the green expiration tent of the scaled-in butterfly.
The net position delta is -2.38.
We need to add upside calendars to give the trade some positive delta and positive theta.
The short option of the calendar needs to have an expiration date the same as the butterfly expiration.
The long option of the calendar needs to be the same strike as the short option but at a further-dated expiration.
Date: 12/13/2023
Price: RUT @ 1947
Sell two February 16 RUT 1960 call @ $60.05
Buy two February 29 RUT 1960 call @ $67.25
Net debit: -$1440
We put the strikes of the calendar above the current price of the RUT so that it looks like this after the adjustment…
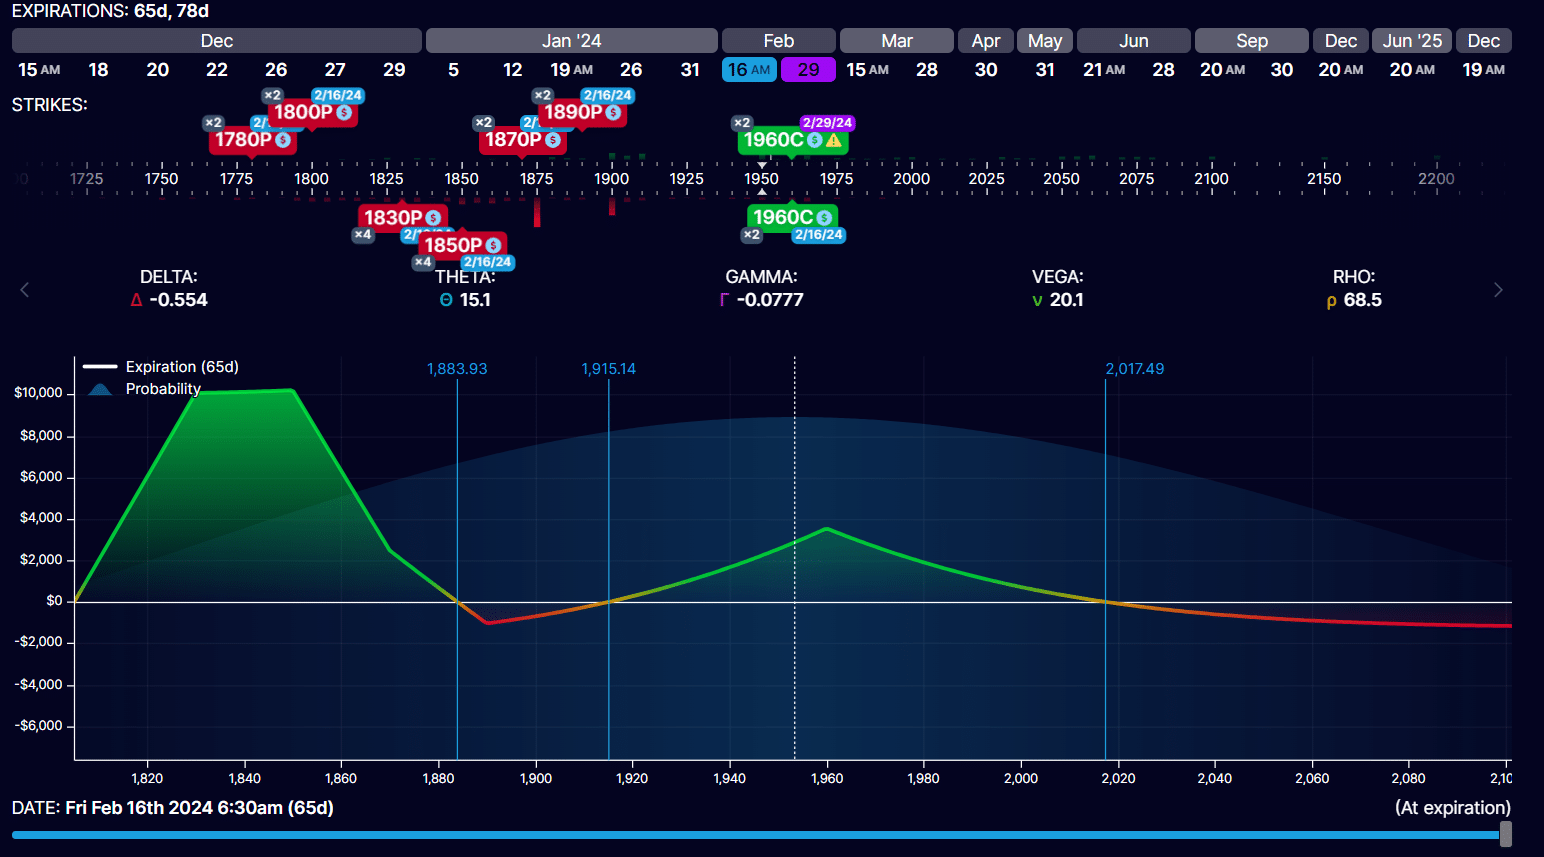
We have significantly reduced our delta closer to zero at -0.55.
And our theta has about doubled to 15.1
Need More Calendars
The next day, on December 14, the rally continues with a gap up and follows through:
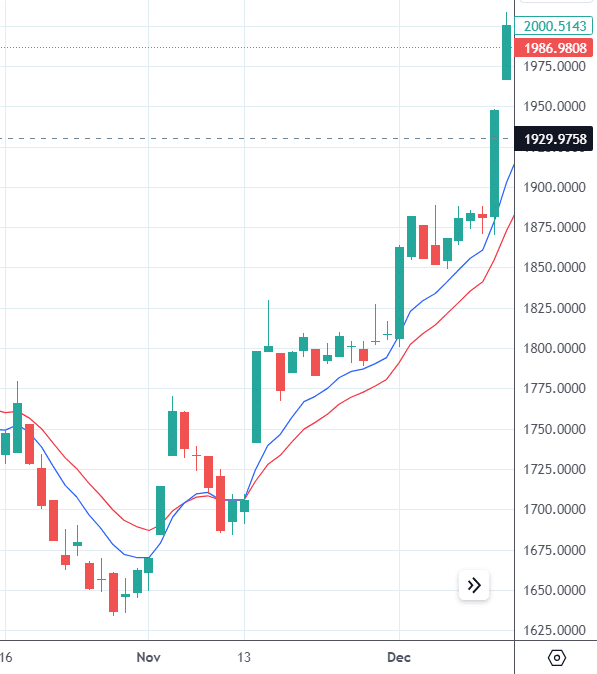
We will add two more 2050 calendars while leaving the existing calendars in place from 1960.
Date: December 14
Sell two February 16 RUT $2050 calls
Buy two February 29 RUT $2050 calls
Net debit: -$1400
The payoff graph now shows the price of RUT at 2000 in between the two sets of calendars:
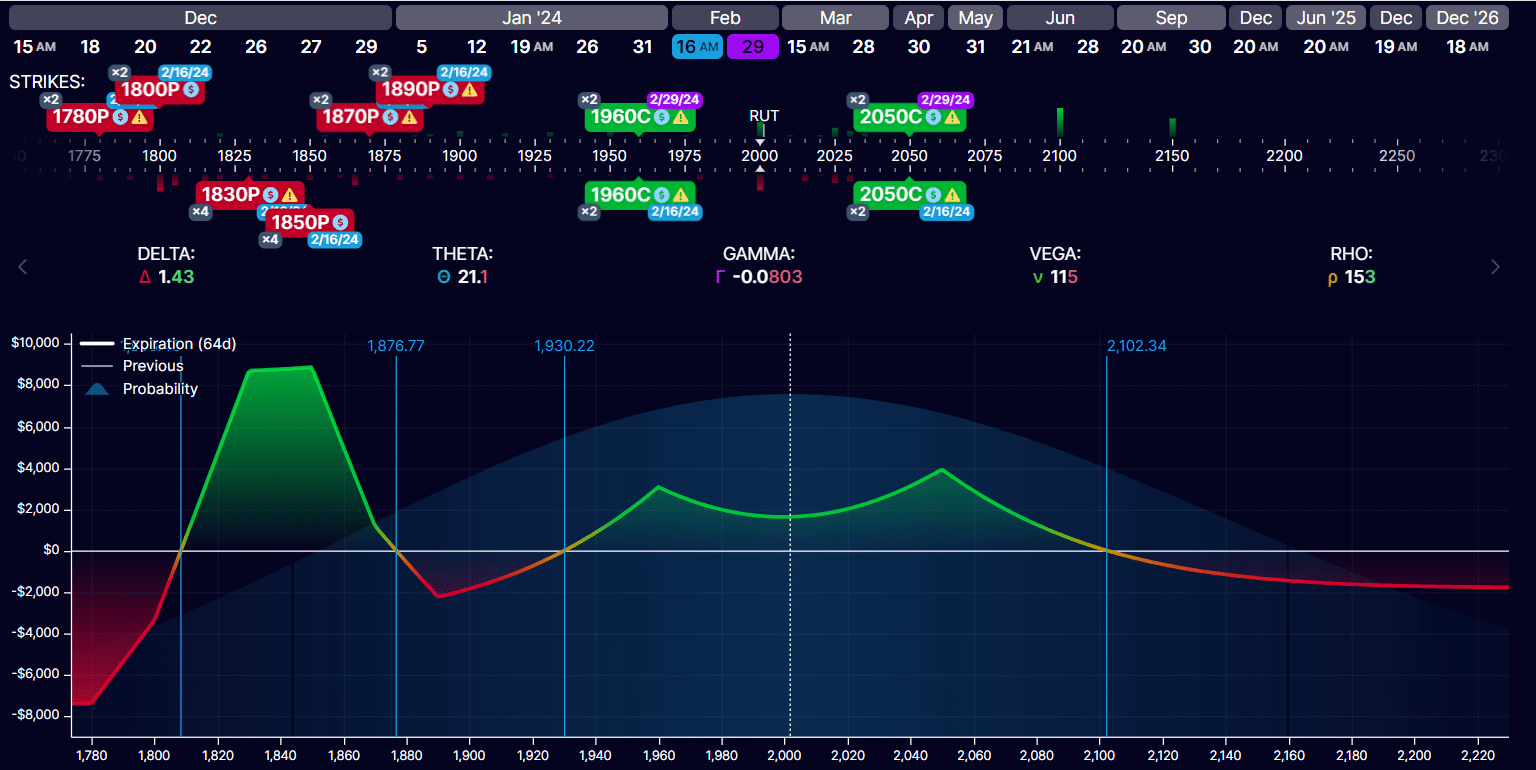
December 19
The market continues to be bullish.
The current price is still in between the two calendars.
But RUT is moving further and further away from our butterflies.
As this happens, the butterfly’s contribution to positive theta decreases.
The value of the butterfly decreases.
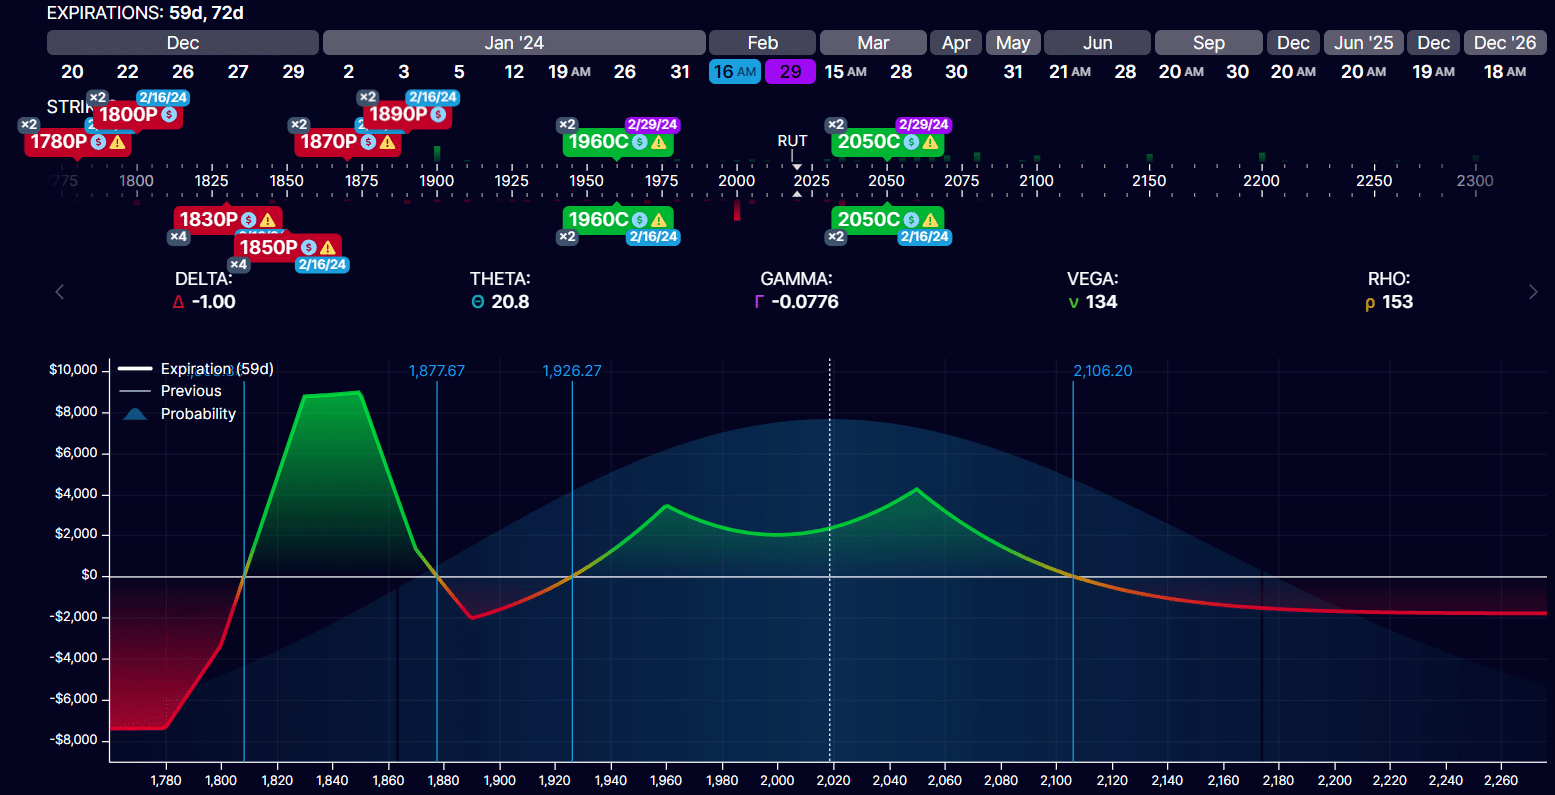
Right now, the entire trade has a theta of 20.
Most of it comes from the calendars.
The furthest away butterfly, 1780/1830/1870, contributes only 1.8 theta.
We will sell this lower 1780/1830/1870 butterfly to get back whatever credit we can from it before its value decreases further if the RUT continues up.
Date: December 19
Price: RUT @ 2017
Sell two February 16 RUT $1870 put
Buy four February 16 RUT $1830 put
Sell two February 16 RUT $1780 put
Net credit: $180
New graph after adjustment:
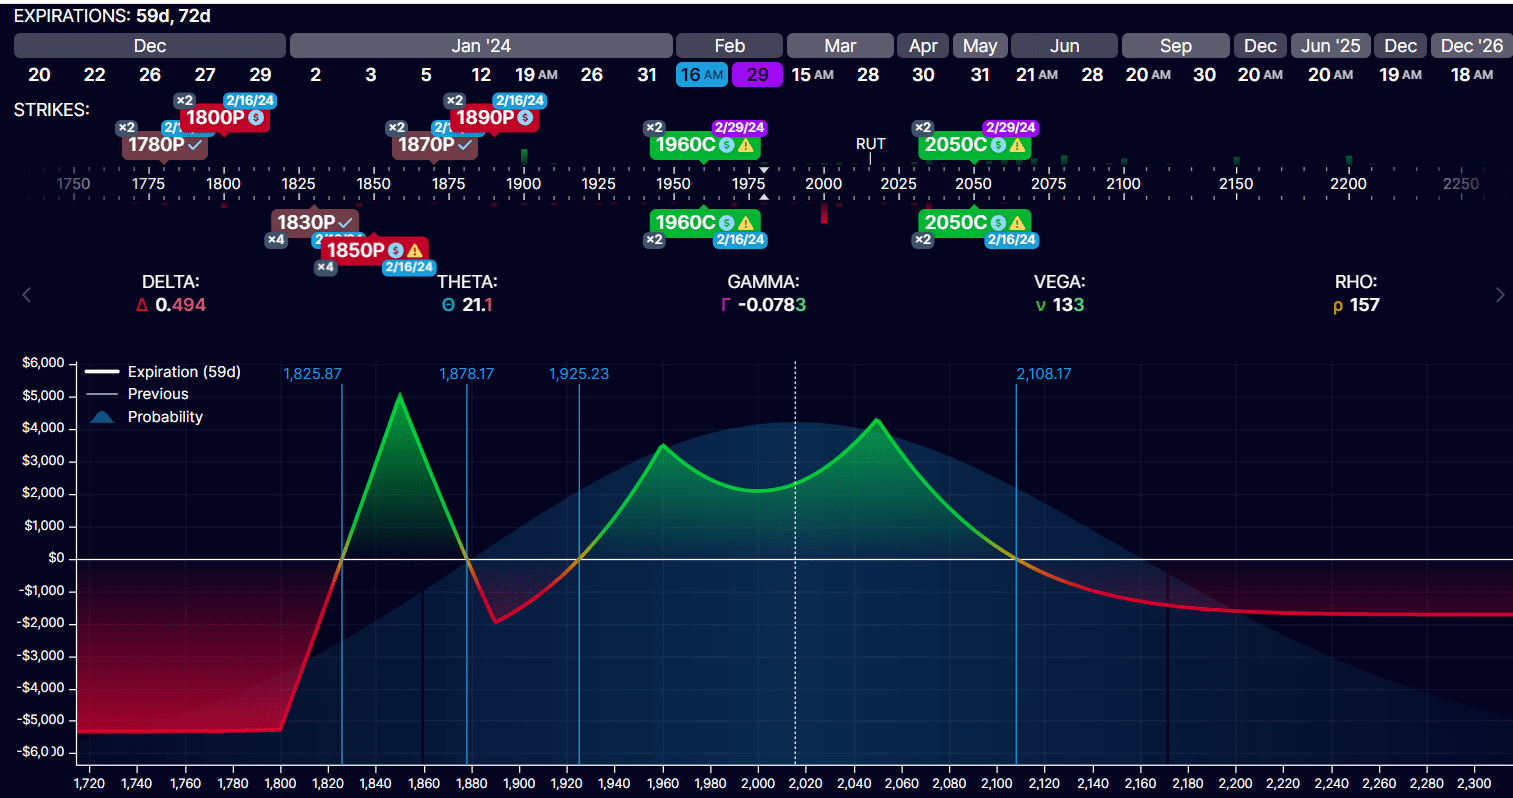
It is funny.
It appears that we have turned this trade into trading a double-calendar, and the butterfly is just a hedge.
December 26
On December 26, after the three-day Christmas weekend, RUT moved higher to 2060, past the upper calendar’s peak.
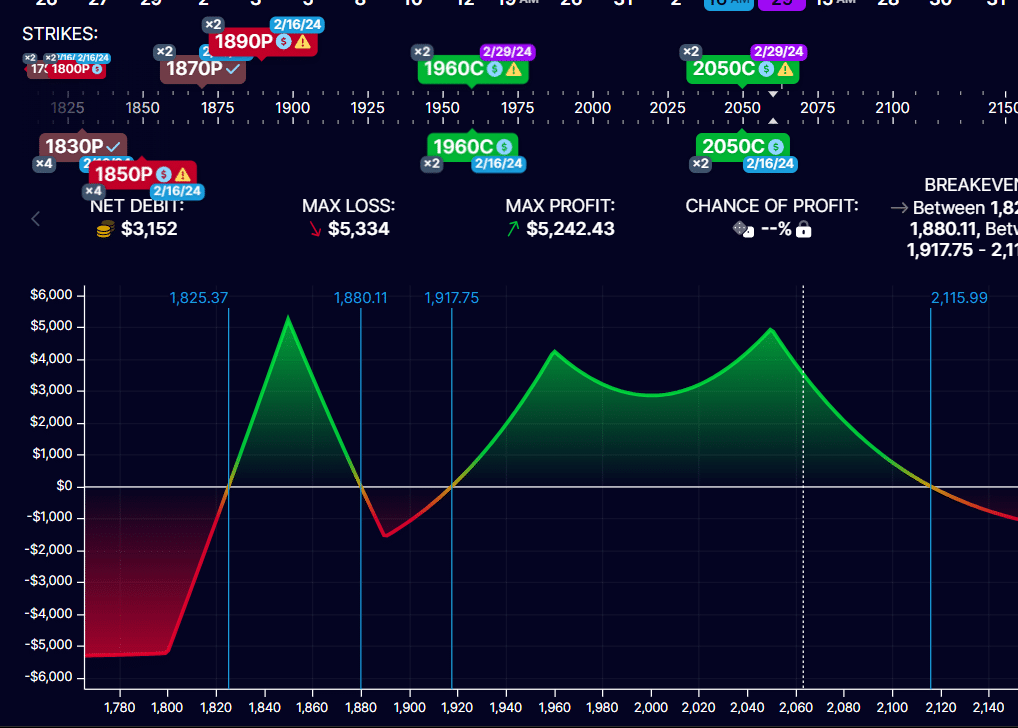
Delta: -3.76
Theta: 29.2
Vega: 147.5
This complex structure consists of three major pieces:
The butterfly (two contracts): delta= -0.86 The lower calendar at 1960 (two contracts): delta = -3.0 The upper calendar at 2050 (two contracts): delta = 0.1Dissecting how the three pieces contribute to the Greeks, we see that most of the negative delta comes from the lower calendar.
The adjustment that we will make is to remove the lower set of calendars:
Buy to close two February 16 RUT 1960 call
Sell to close two February 29 RUT 1960 call
Net credit: $1500
Since we paid $1440 originally for those calendars, we made a profit of $60 on these calendars.
After the adjustment, our structure has been simplified a bit:
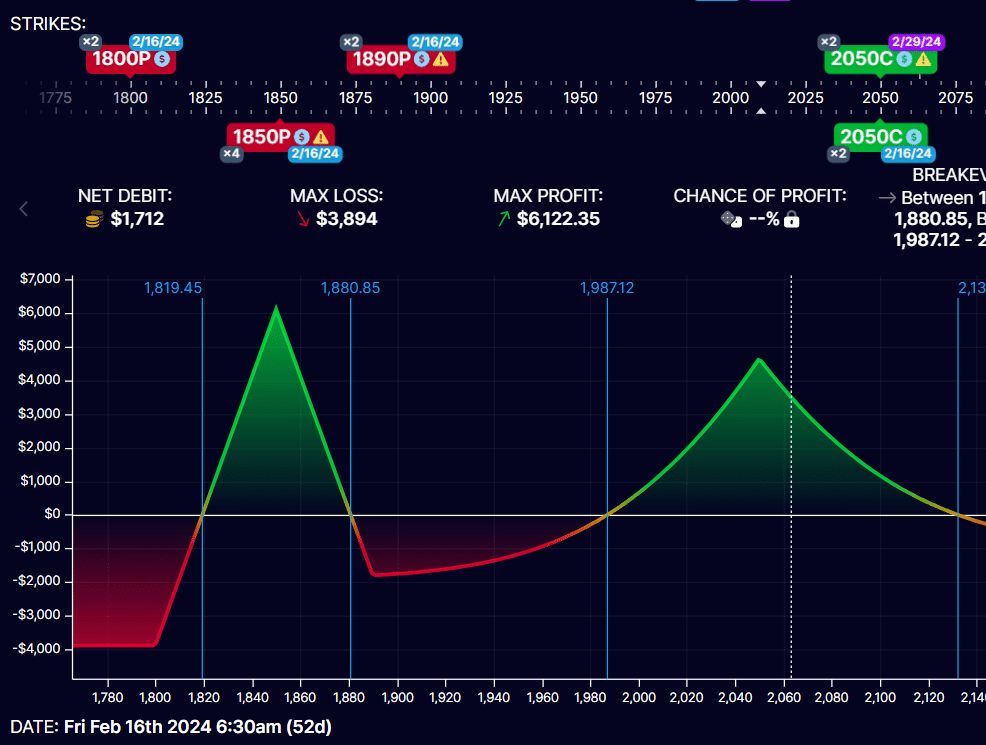
Delta: -0.76
Theta: 16.8
Vega: 72.2
The overall effect of removing the negative delta from the lower calendars is that we got it closer to zero.
Access The Top 7 Tools For Option Traders
January 3, 2024
RUT made a down move to 1984, which meant the price came out of the calendar expiration tent.
The net delta is at +6.
Selling both calendars for a credit of $725 each, we get a net credit of $1450.
Resulting graph:
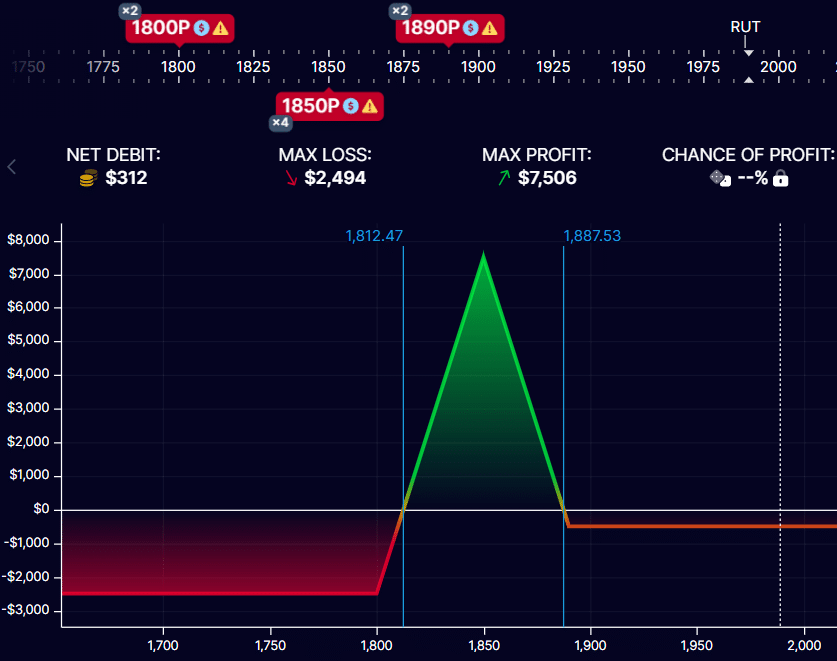
Delta: -0.5
Theta: 4.1
Vega: -16.6
Still 44 days to expiration.
It is amazing that with RUT at a value of 1964, so far away from the butterfly, the butterfly is still generating positive theta.
With the upside max risk at around -$270 right now, the fly can remain in this configuration for a while as long as it generates positive theta with minimal risk.
Getting More Theta
Below is the position that we have on January 8.
The asset price where the white vertical line is way higher than the butterfly.
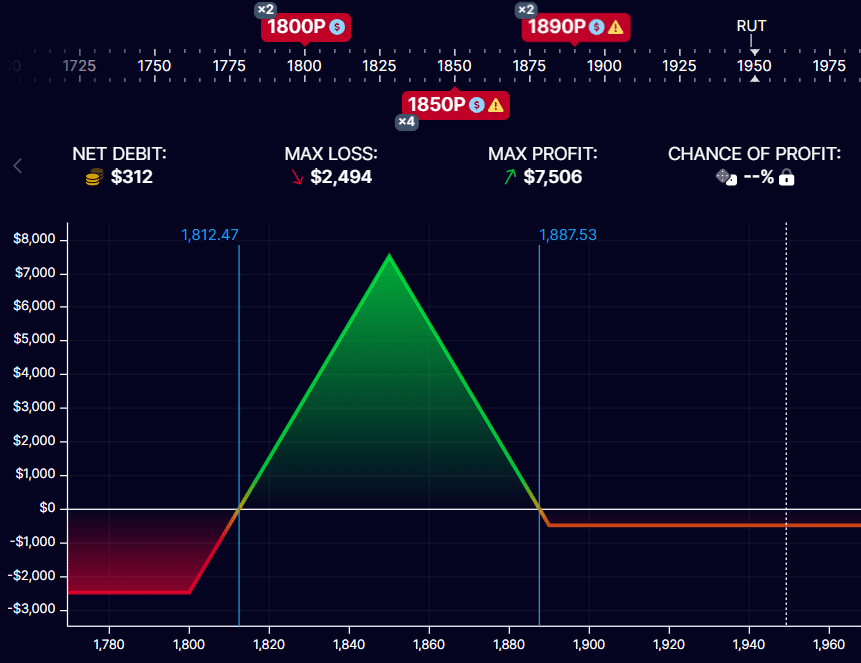
Delta: -1.7
Theta: 6.5
Vega: -18.8
When the trade is in this configuration, and we have negative delta, we can make the trade more bullish to generate more theta.
We have two butterfly contracts.
We will make one of them a tad more bullish by selling a credit spread on the upper leg.
Sell one February 16 RUT 1890 put
Buy one February 16 RUT 1880 put
Credit: $230
The resulting graph shows that we have reduced the upside risk in the trade:
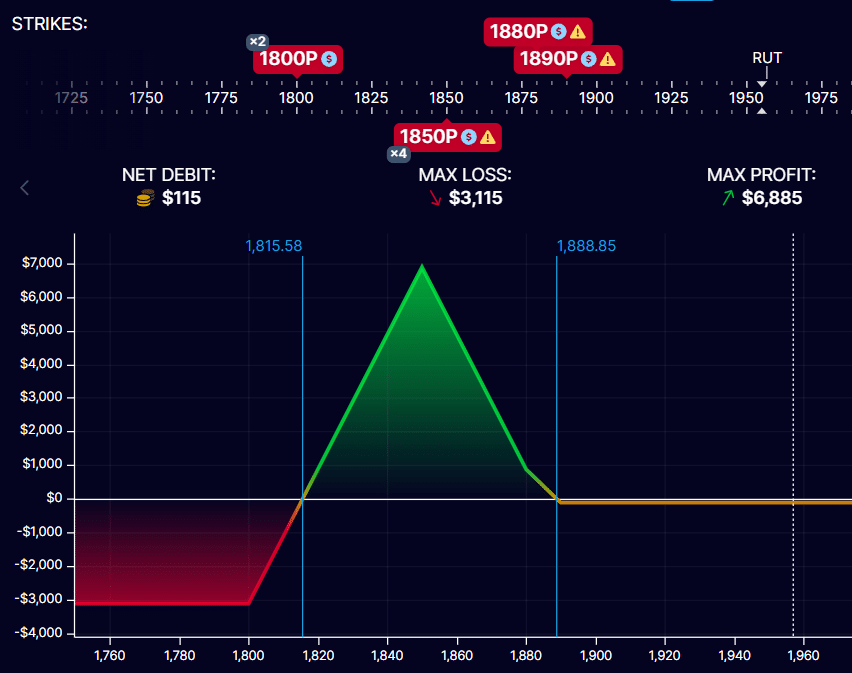
At the same time, we got the delta positive and closer to zero while increasing theta.
Delta: 0.6
Theta: 8.1
Vega: -28.2
We now have two slightly different butterflies – one is more bullish than the other, giving us additional potential adjustment choices.
If the market moves up, we exit the more bearish butterfly.
If the market goes down, we exit the more bullish butterfly.
Exiting The Trade – January 9, 2024
Because RUT is so far away from the fly, its theta generation potential is low.
We can reuse the capital for a new trade closer to the money.
So, we decided to close the Rhino after 37 days in the trade (slightly over a month).
We have 37 days till expiration, which is halfway through the 74 DTE trade duration.
If we didn’t close it today, we would have closed it tomorrow before the CPI numbers were released the following day, which could potentially move the market.
Sell each of the remaining two contracts:
Sell to close: one February 16 RUT 1800 put
Buy to close: two February 16 RUT 1850 put
Sell to close: one February 16 RUT 1890 put
Credit: $180
Sell to close: one February 16 RUT 1800 put
Buy to close: two February 16 RUT 1850 put
Sell to close: one February 16 RUT 1890 put
Credit: $35
The trade made a net profit of $150, excluding commissions and fees.
With the current risk in the trade at $3000, this is about a 5% return on the current risk of the trade.
However, the trade had seen a max risk of $7500 at one point when we had a scaled-in Rhino and double calendars.
Based on this, our return is about 2% of the max capital at risk.
This would be the more accurate statistic to use.
You can roughly say that this Rhino made 2% in about a month.
Conclusion
Although we would have liked to have made greater profits on the trade, the market was making excessive moves for a market-neutral trading strategy.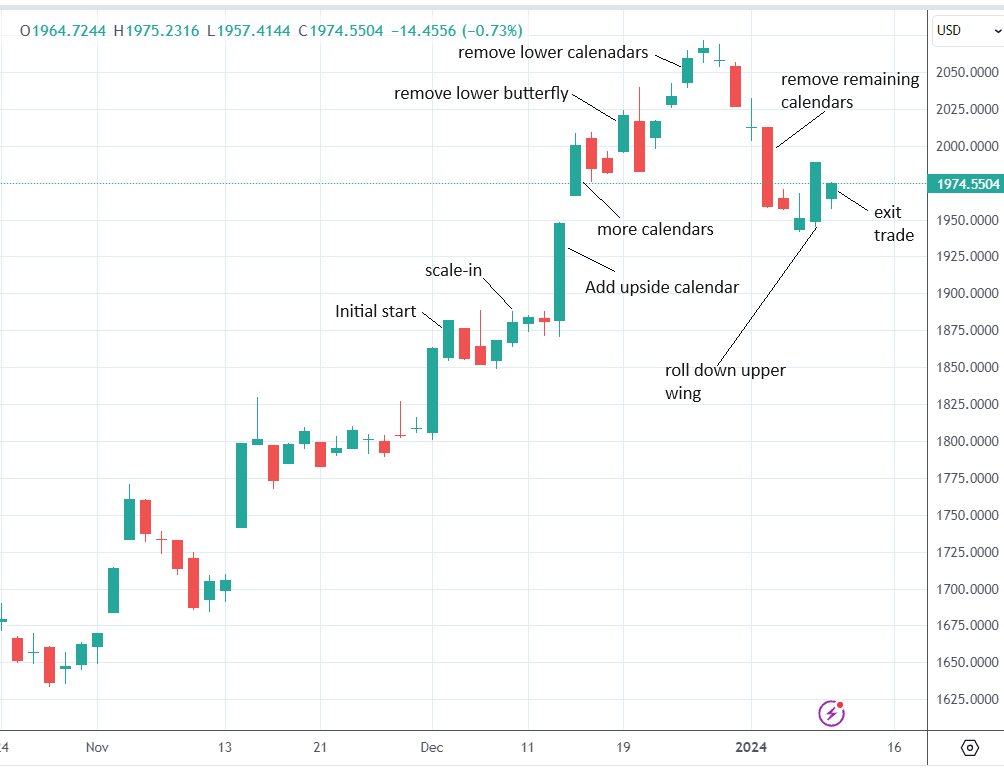
Nevertheless, the Rhino can most likely survive large up moves with proper adjustments.
However, it can not always survive large down moves.
We hope this is an instructive trade example on adjusting Rhino butterflies when the market moves up.
If you have any questions, please send an email or leave a comment below.
Trade safe!
Disclaimer: The information above is for educational purposes only and should not be treated as investment advice. The strategy presented would not be suitable for investors who are not familiar with exchange traded options. Any readers interested in this strategy should do their own research and seek advice from a licensed financial adviser.


 Bengali (Bangladesh) ·
  English (United States) ·