A “ratio diagonal” is like a diagonal option spread, except that the number of short and long options is unequal.
This will make more sense when we first look at a typical diagonal example on SPY, the S&P 500 ETF.
Afterwards, we will look at the ratio diagonal.
Contents
Typical Diagonal The Short Ratio Diagonal Long Ratio DiagonalTypical Diagonal
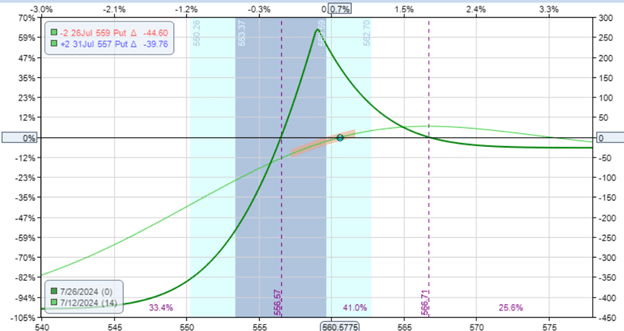
Here is a typical bullish put diagonal:
Date: July 12, 2024
Price: SPY @ $560.57
Sell two July 26 SPY $559 put @ $2.91
Buy two July 31 SPY $557 put @ $3.05
Net debit: -$27

We are selling two contracts, and we are buying two contracts at different expirations.
Like the calendar, the diagonal has the long options (the options we buy) at a later expiration than the short options (the options we sell).
This is a typical diagonal spread because the number of options we buy is the same as the number of options we sell (in this case, it is two contracts).
This equal number of long and short options makes the trade a defined-risk trade.
You can see from the expiration risk graph that the risks taper off to a maximum loss of about $425 as the price of SPY drops.
The spread is bullish because the short options are closer to the money than the long ones, with some positive deltas.
Here are the Greeks:
Delta: 9.79
Theta: 2.60
Vega: 11.21
Like the calendar, the diagonal has positive theta and is positive vega.
Positive theta means that the spread increases in value as time passes, assuming all other factors remain unchanged.
Positive vega means that the trade, in theory, should benefit when implied volatility increases.
The Short Ratio Diagonal
The ratio diagonal is based on the diagonal, except we have an extra short contract.
Date: July 12, 2024
Price: SPY @ $560.57
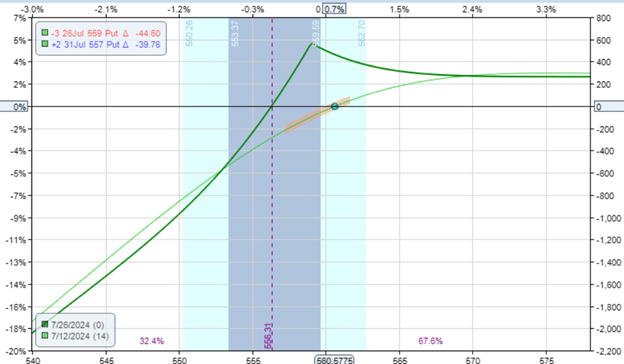
Sell three July 26 SPY $559 put @ $2.91
Buy two July 31 SPY $557 put @ $3.05
Net Credit: $264
We have a net overall credit because of the extra short contract we are selling.
You can tell from the expiration graph that by selling an extra put option, the trade is made a lot more bullish:

Covered Call Calculator Download
Whereas the typical diagonal is a defined-risk trade, this ratio diagonal with the extra short put makes the trade an undefined-risk trade.
This is because there are fewer number of long options to cover the number of short options. There is one extra uncovered short-put option.
If the account has enough cash to buy 100 shares of SPY, if the short put is assigned at expiration, it would be considered a “cash-secured put.”
The trader, if assigned, can decide to hold those shares and convert the trade to the Wheel Strategy.
Looking at the Greeks, we see this spread is much more bullish with 54 deltas.
Delta: 54.36
Theta: 16.40
Vega: -31.92
Selling more options means that it has a lot more theta.
The spread is net short options.
Hence, its vega is negative.
Short options have negative vegas.
And long options have positive vegas.
The Greeks and the current time profit line have characteristics similar to that of a bull put credit spread.
This trade would behave similarly to that of a credit spread.
The only difference is that a credit spread is a defined risk trade, and this is an undefined risk trade.
Long Ratio Diagonal
It is possible to have a ratio diagonal with more long options than short options, such as:
Date: July 12, 2024
Price: SPY @ $560.57
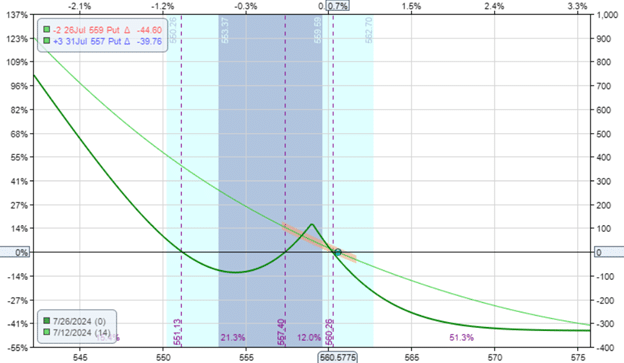
Sell two July 26 SPY $559 put @ $2.91
Buy three July 31 SPY $557 put @ $3.05
Net debit: -$332
Because we are buying more than we are selling, we pay a net debit.
This also makes it a defined-risk trade, with the max risk being the debit paid.

We see that this trade is in a completely different direction.
As constructed, it is a bearish trade with negative deltas:
Delta: -30
Theta: -9.91
Vega: 60
It also has a negative theta, which means it loses money as time passes (similar to a long option).
Because it has more long puts than short puts, the overall trade would have characteristics of long options.
Conclusion:
The ratio diagonal has an unequal number of short and long options.
Here, we used the ratio of two by three.
Some ratio diagonal uses the ratio of one to two.
We do not see the ratio diagonal spread being used that often.
This is likely because the characteristics of the ratio diagonal can often be achieved more simply by using other spreads.
Nevertheless, it is always interesting to explore new option constructions.
We hope you enjoyed this article about ratio diagonal spreads.
If you have any questions, please send an email or leave a comment below.
Trade safe!
Disclaimer: The information above is for educational purposes only and should not be treated as investment advice. The strategy presented would not be suitable for investors who are not familiar with exchange traded options. Any readers interested in this strategy should do their own research and seek advice from a licensed financial adviser.


 Bengali (Bangladesh) ·
  English (United States) ·